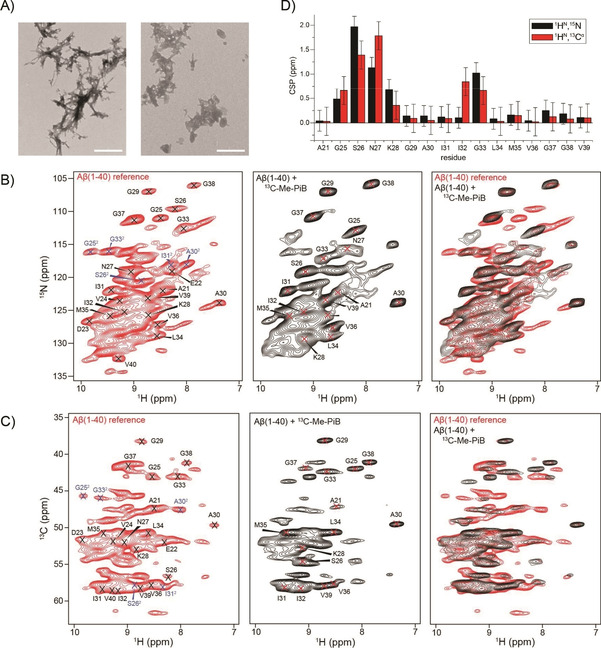
Figure 3.

A) TEM images of Aβ(1‐40) fibrils (left), and Aβ(1‐40) fibrils in the presence of a fourfold molar excess of DABTA (right); scale bars: 500 nm. Individual and superimposed B) 2D 1H,15N correlation spectra and C) 2D 1HN,13Cα correlation spectra of 2H,13C,15N‐labeled Aβ(1‐40) fibrils in the absence (red) and presence (black) of an equimolar amount of 13C−Me−PiB. For the reference fibril sample, two sets of resonances are observed for the loop residues G25, S26, as well as for A30, I31 and G33 (indicated in blue). These peaks are strongly attenuated in the presence of 13C−Me−PiB. Fibrils were formed in phosphate buffer (prepared with H2O) to yield full protonation at exchangeable sites. 2D 1HN,15N and 1HN,13Cα correlation spectra were recorded on a Bruker Avance III 800 MHz spectrometer. The MAS rotation frequency was adjusted to 52 kHz. The effective sample temperature was kept constant at around 15 °C. D) Chemical shift perturbations (CSP) for 1HN,15N and 1HN,13Cα resonances obtained for a fibril reference sample and a fibril sample incubated with an equimolar amount of 13C−Me−PiB. CSPs were calculated from Equations 1 and 2 in the Experimental Section.
