Figure 2.

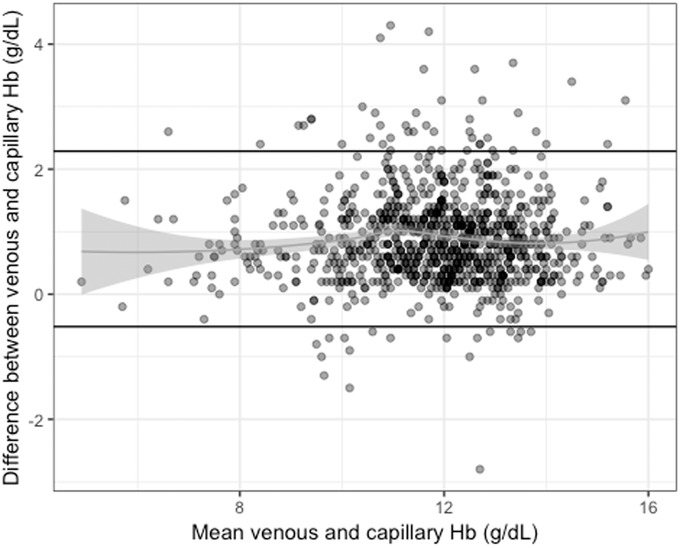
Bland−Altman plot for difference between venous and capillary hemoglobin concentration in 997 nonpregnant WRA. Dark horizontal lines represent 95% confidence intervals around the mean difference between venous and capillary hemoglobin.

Bland−Altman plot for difference between venous and capillary hemoglobin concentration in 997 nonpregnant WRA. Dark horizontal lines represent 95% confidence intervals around the mean difference between venous and capillary hemoglobin.