
FIGURE 7.
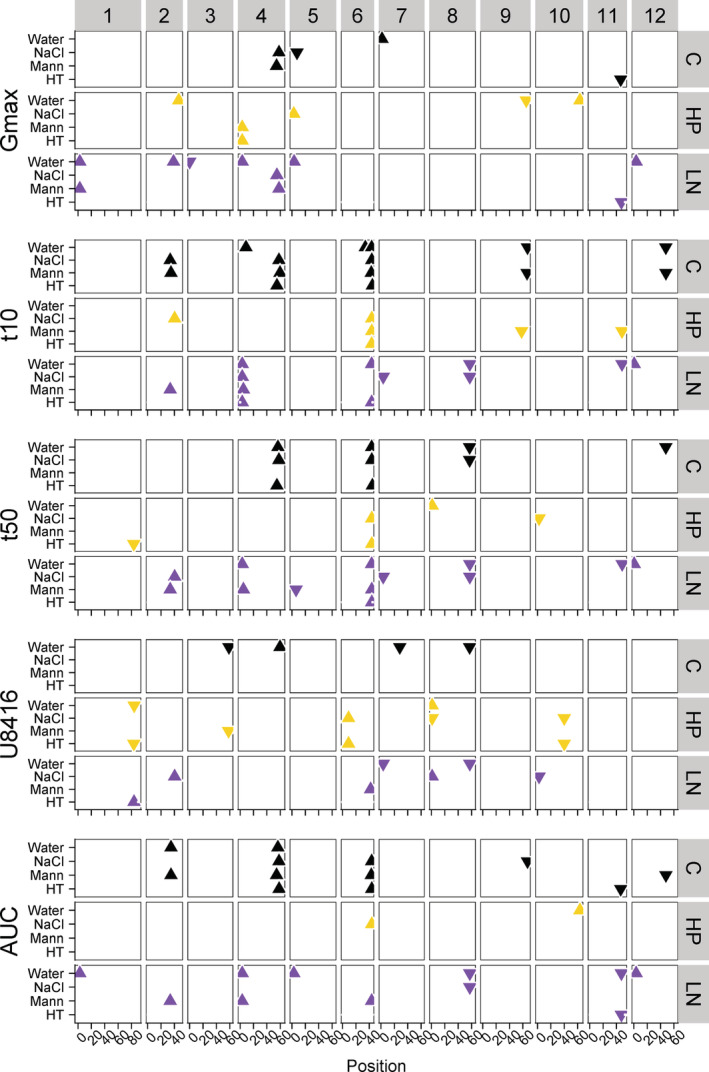
Comparison between the QTLs found in the sub‐optimal maternal conditions in this study and the QTLs found in the control maternal conditions from Kazmi et al., 2012. Chromosomes are indicated on top. Maternal conditions are shown on the right and indicated by colors (control conditions in black, HP in yellow and LN in purple), phenotypes are shown on the left. Germination environments are shown on the y‐axis and the position on the genome on the x‐axis (in Mbp). Triangle pointed upwards means the MM allele increased the phenotype compared to the Pimp allele and vice versa for the triangle pointed downwards. QTL, quantitative trait loci [Colour figure can be viewed at wileyonlinelibrary.com]