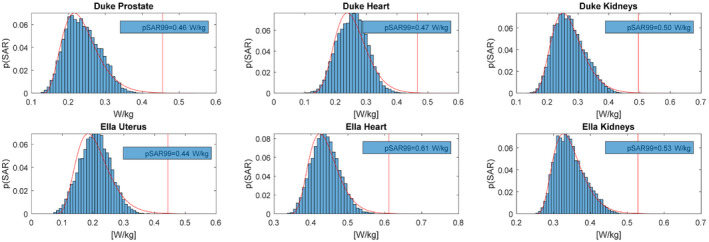
FIGURE 4.

Peak specific absorption rate (SAR) values for different imaging targets, considering radiofrequency (RF) shims that were optimized for uniformity or efficiency in the imaging target and all RF shims within the range shimmed by these two solutions. About 1W total input power was used in all cases. A gamma distribution was fitted to the distribution of peak SAR values, to find a SAR value that has a chance of less than 0.1% of being exceeded for the fitted distribution (pSAR99 value). y‐axis represents the probability of occurrence for a given SAR level, where the total probability sums up to 1
