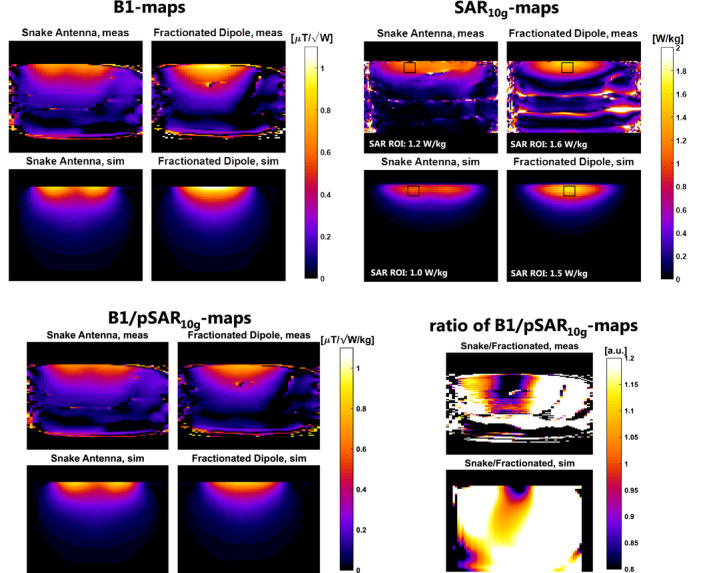
FIGURE 6.

Single channel validation results, showing simulated and measured B1 and specific absorption rate (SAR)10g maps for the fractionated dipole antenna and the snake antenna. Additionally, B1‐maps are shown after normalization for peak SAR10g (SAR efficiency). The ratio of SAR efficiency that the snake antenna has a higher SAR efficiency for locations at depth and away from the center of the antenna. This effect is somewhat stronger in simulation, where B1 coverage is available at depth
