
FIGURE 2.
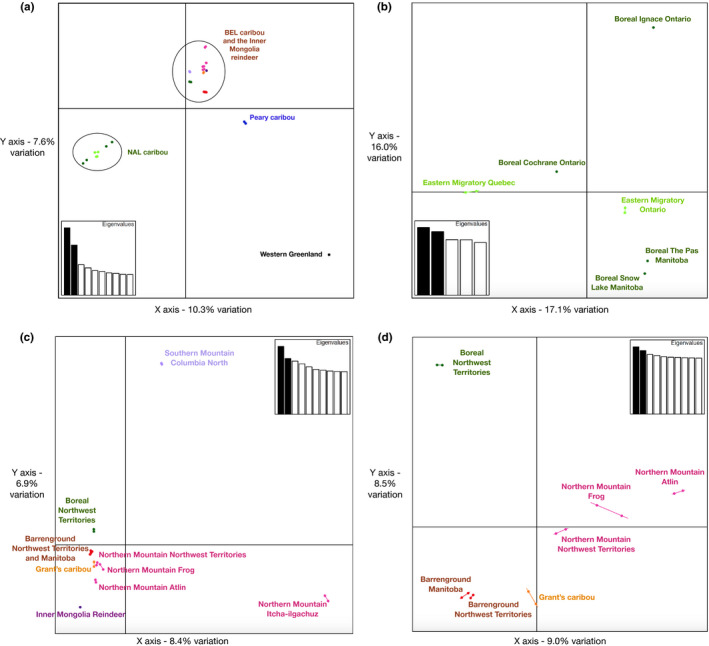
Principal component analyses of caribou genetic variation. All plots show PC1 (x‐axis) and PC2 (y‐axis) shown by the eigenvalues plot in the corners. The plots show PCA of all 30 caribou and the Inner Mongolian reindeer (a), fine‐scale analysis of the NAL caribou (b), fine‐scale analysis of the BEL caribou, aside from Peary and Western Greenland (c) and fine‐scale analysis of the 14 individuals clustered together from Figure 3c (d)[Colour figure can be viewed at wileyonlinelibrary.com]