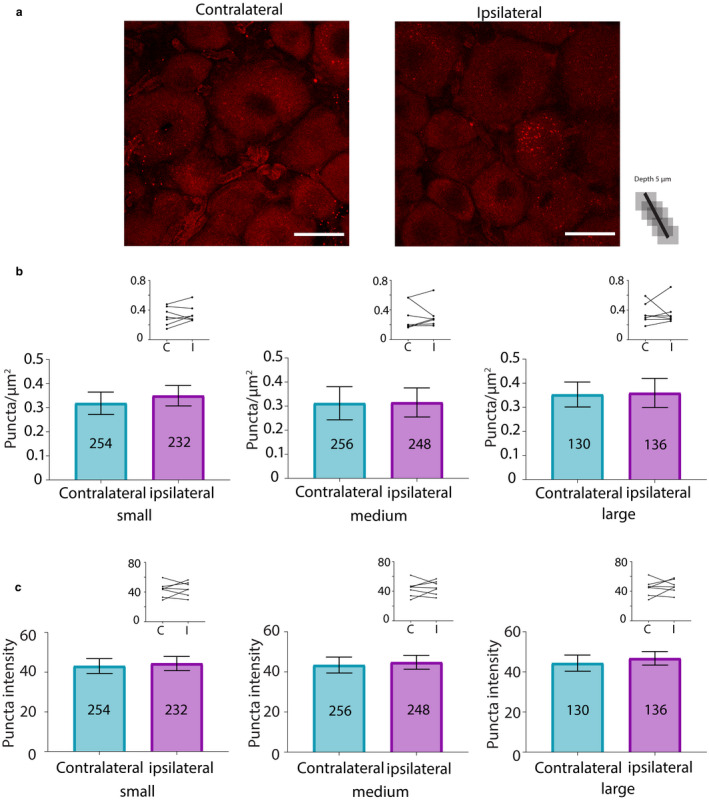
Figure 7.

SUMOylation of HCN2 channels by SUMO2/3 does not change 3 days post‐CFA. (a) Representative PLA. Scale bars are 25 µm. Note that this image provides an overview, but for the purpose of quantification, individual projections were made for each cell, for example, Figure 5b. (b) Plots of mean number of puncta/µm2 for all DRG from seven CFA treated animals on day 3 post‐CFA. The number inside the bar represents the total number of cells analysed. Inset: Each line compares means for contralateral and ipsilateral DRG from one animal. Wilcoxon matched‐pair tests indicate no significant difference in puncta number for small, medium or large diameter cells (small, 0.32 ± 0.05 vs. 0.35 ± 0.04, p = 0.375; medium, 0.31 ± 0.07 vs. 0.32 ± 0.06, p = 0.5781; large, 0.35 ± 0.05 vs. 0.36 ± 0.06, p = 0.8125). (c) Plots of mean puncta intensity on day 3 post‐CFA. Paired t‐tests indicate mean puncta intensities were not significantly different for any size category in ipsilateral compared to contralateral DRG (small, 43.13 ± 3.73 vs. 44.4 ± 3.56, p = 0.731; medium, 43.4 ± 3.98 vs. 44.78 ± 3.45, p = 0.7087; large; 44.35 ± 4.04 vs. 46.75 ± 3.36, p = 0.5670). CFA, Complete Freund's Adjuvant; DRG, dorsal root ganglia; HCN2, hyperpolarization‐activated, cyclic nucleotide‐gated 2; PLA, proximity ligation assays; SUMO, small ubiquitin like modifier
