

Abstract
Background
Computed tomography-guided transthoracic needle biopsy (CT-TNB) is a widely used method for diagnosis of lung diseases; however, CT-TNB-induced bleeding is usually unexpected and this complication can be life-threatening. The aim of this study was to develop and validate a predictive model for hemoptysis following CT-TNB.
Methods
A total of 436 consecutive patients who underwent CT-TNB from June 2016 to December 2017 at a tertiary hospital in China were divided into derivation (n = 307) and validation (n = 129) cohorts. We used LASSO regression to reduce the data dimension, select variables and determine which predictors were entered into the model. Multivariate logistic regression was used to develop the predictive model. The discrimination capacity of the model was evaluated by the area under the receiver operating characteristic curve (AUROC), the calibration curve was used to test the goodness-of-fit of the model, and decision curve analysis was conducted to assess its clinical utility.
Results
Five predictive factors (diagnosis of the lesion, lesion characteristics, lesion diameter, procedure time, and puncture distance) selected by LASSO regression analysis were applied to construct the predictive model. The AUC was 0.850 (95% confidence interval [CI], 0.808–0.893) in the derivation, and 0.767 (95% CI, 0.684–0.851) in the validation. The model showed good calibration consistency (p > 0.05). Moreover, decision curve analysis indicated its clinical usefulness.
Conclusion
We established a predictive model that incorporates lesion features and puncture parameters, which may facilitate the individualized preoperative prediction of hemoptysis following CT-TNB.
Keywords: Lung, Biopsy, Hemoptysis, Nomogram
Background
Currently, low-dose computed tomography (CT) is recommended for lung cancer screening in routine clinical practice at many certified medical centers [1, 2]. This recommendation has contributed to increment the number of CT-detectable pulmonary lesions, including asymptomatic pulmonary nodules and masses [3]. Generally, in the presence of lesions larger than 10 mm or smaller lesions with a rapid growth rate, additional diagnostic procedures would be needed, such as transthoracic lung biopsy guided by CT, transbronchial lung biopsy guided by endobronchial ultrasound or virtual bronchoscopic navigation, or surgery [1, 4]. Among these procedures, CT-guided transthoracic needle biopsy (CT-TNB) is usually the preferred method because it is minimally invasive, has higher diagnostic accuracy and a lower cost [4–6]. However CT-TNB also has complications, such as hemoptysis, which occurs with a frequency of 0.5–14.4%, and intrapulmonary hemorrhage, with an even higher rate of 2.9–54.5% [4, 5].
Nowadays, CT-TNB is routinely performed on an outpatient basis in many medical units. In this scenario, an important issue concerning outpatient management is not the occurrence of hemoptysis per se, but hemoptysis requiring hemostatic therapy and patient hospitalization. Therefore, it would be helpful if clinicians could predict the risk of post-CT-TNB hemoptysis in clinical practice. Unfortunately, to our knowledge, there is no recommended model for the prediction of post-CT-TNB hemoptysis.
In the present study, we retrospectively investigated patients’ clinical characteristics, lesion features, and CT-TNB parameters, in order to establish a predictive model based on valuable predictors of post-CT-TNB hemoptysis.
Methods
Participants
A total of 436 consecutive patients who underwent CT-TNB at a tertiary hospital (Jinhua Hospital of Zhejiang University, Jinhua, China) from June 2016 to December 2017 were enrolled in this study. Of these, 309 patients were randomly assigned to the derivation dataset, while the remaining patients (n = 127) were assigned to the validation cohort. This study was performed in accordance with the Declaration of Helsinki, which was revised in 1983. The study was approved by the ethics committee of Jinhua Hospital of Zhejiang University (No. 2018001008). All patient information was handled anonymously and informed consent was therefore waived.
Variables collection
Preoperative laboratory examinations, lesion features, and surgical procedure information were extracted from hospital information system [7]. Clinical characteristics included gender, age, heart rate, systolic and diastolic blood pressure, room-air oxygen saturation, and coexisting chronic obstructive pulmonary disease (yes/no). Laboratory examinations included prothrombin time, platelets, D-dimer, serum tumor markers (carcinoembryonic antigen, squamous cell carcinoma antigen, and CYFRA21-1), fasting blood glucose, triglyceride, and C-reactive protein. Lesion features included the diagnosis of the lesion, lesion diameter (1–2 cm, 2–3 cm, and ≥ 3 cm), lesion location I (left/right lung), lesion location II (hilum, upper/lower lung, or middle lung), lesion characteristics (ground-glass, solid, or cavitary lesion), lesion burr (yes/no), the shortest distance from the lesion to nearby vessel (< 10 mm, or ≥ 10 mm), CT-attenuation value. Surgical procedure information included puncture position (supine, prone, or lateral position), procedure time, puncture distance (the straight-line distance from the pleura to the center of the lesion), biopsy times, and hemoptysis after procedure (yes/no) [7].
CT-TNB procedure
Participants received CT-TNB in different positions on the basis of the calculation of the shortest distance from the center of the lesion to the body surface. All biopsies were performed by a qualified physician, who has been performed more than 5000 cases of CT-TNB in the past 20 years. In this study, a coaxial 18-gauge needle (Lot Number, REXK0682; Bard Peripheral Vascular, Inc., Tempe, AZ) was used for all biopsies [7]. Generally, two biopsies were performed; however, additional biopsies were required when needed [7].
Patients were requested to maintain the supine position for at least 6 h following CT-TNB and were allowed to get out of bed 24 h later. In this study, we defined ≥1 new post-CT-TNB bloody sputum episode as hemoptysis (new meaning that the patient had never had bloody sputum or hemoptysis before the biopsy). Generally, patients with limited hemoptysis spontaneously regained hemostasis, and treatment was only required when the severity of hemoptysis increased. The patient who had post-CT-TNB severe hemoptysis would be required to rest in bed absolutely, and be encouraged to cough up blood clots. Hemocoagulase and vasopressin were used for hemostasis.
Statistical analysis
Multiple imputation method was applied to account for missing data. Summary statistics were used to describe subject characteristics. Continuous data were expressed as medians (interquartile range), and categorical data were presented as the number and the percentage. The unpaired t-test or the Mann-Whitney U test, the Pearson chi-squared test or the Fisher’s exact test was used to compare characteristics between the derivation and validation cohorts. In this study, we followed the methods as previously described [7]. The least absolute shrinkage and selection operator (LASSO) regression method was applied to filter potential predictors, and logistic regression analysis was used to develop the predictive model for post-CT-TNB hemoptysis. Nomogram was constructed to facilitate the use in clinical practice. The discrimination ability of the model was assessed by calculating the area under the receiver operating characteristic curve (AUROC). Calibration curve was constructed and the unreliability test was performed to evaluate the goodness-of-fit of the model. The model was assessed for clinical utility using decision curve analysis (DCA) [8]. R software (version 3.5.1; https://www.r-project.org) was used for statistical analyses, and statistical significance was defined as a p-value < 0.05.
Results
In the derivation cohort, 43.7% (134/307, 95% confidence interval [CI], 38.1–49.2%) of patients experienced hemoptysis following CT-TNB, and 2 (1.5% of the hemoptysis) cases required hemostasis treatment. In the validation cohort, the incidence of hemoptysis was 41.1% (53/129, 95% CI, 32.6–49.6%), and 1 (1.9% of the hemoptysis) patient required hemostasis treatment. One patient died from severe postoperative blood loss. This patient was a 53-year-old man with hypertension and uremia. A solid mass with a diameter of 3.3 cm in the right middle lobe was found on CT scan, and the shortest distance from the center of the lesion to the body surface was 1.5 cm. This patient received CT-TNB in supine position and only one biopsy was performed. The postoperative pathological result of the lesion was pulmonary inflammatory pseudotumor. Patient’s clinical characteristics, laboratory tests, and biopsy parameters are shown in Table 1.
Table 1.
Patient’s clinical characteristics, laboratory tests, and biopsy parameters
| Variables | Overall cohort | Derivation cohort | Validation cohort | P-value |
|---|---|---|---|---|
| No (n = 436) | Yes (n = 307) | (n = 129) | ||
| Hemoptysis, n (%) | 187 (42.89) | 134 (43.65) | 53 (41.09) | 0.622 |
| Gender, n (%) | 0.848 | |||
| Female | 166 (38.07) | 116 (37.79) | 50 (38.76) | |
| Man | 270 (61.93) | 191 (62.21) | 79 (61.24) | |
| Age, (year) | 63 (54–70) | 63 (54–71) | 63 (54–70) | 0.836 |
| SBP, (mmHg) | 128 (117–141) | 128 (117–142) | 130 (116–139) | 0.933 |
| DBP, (mmHg) | 78 (70–84) | 78 (70–84) | 76 (70–83) | 0.322 |
| HR, (beat/min) | 80 (72–88) | 80 (72–87) | 80 (68–89) | 0.814 |
| SPO2, (%) | 98 (96–98) | 97 (96–98) | 98 (96–99) | 0.040 |
| COPD, n (%) | 0.429 | |||
| No | 309 (70.87) | 221 (71.99) | 88 (68.22) | |
| Yes | 127 (29.13) | 86 (28.01) | 41 (31.78) | |
| PT, (s) | 12.40 (11.50–13.30) | 12.40 (11.50–13.25) | 12.40 (11.70–13.40) | 0.475 |
| D-Dimer, (mg/mL) | 591.0 (320.0–1269.8) | 611.9 (337.0–1361.0) | 544.0 (290.0–988.0) | 0.501 |
| Platelets, (× 109/L) | 231 (177–285) | 235 (179–286) | 226 (171–285) | 0.493 |
| CRP, (mg/L) | 3.95 (0.80–24.92) | 4.50 (0.90–25.00) | 3.00 (0.60–24.80) | 0.519 |
| Blood glucose, (mmol/L) | 5.38 (4.74–6.71) | 5.37 (4.75–6.69) | 5.39 (4.74–6.77) | 0.419 |
| Triglyceride, (mmol/L) | 1.12 (0.86–1.52) | 1.11 (0.84–1.54) | 1.14 (0.90–1.42) | 0.556 |
| SCC, (μg/L) | 0.70 (0.50–1.20) | 0.70 (0.50–1.05) | 0.80 (0.60–1.30) | 0.132 |
| CYFRA21-1, (ng/mL) | 2.55 (1.50–5.26) | 2.40 (1.45–4.95) | 2.80 (1.60–6.40) | 0.094 |
| CEA, (ng/mL) | 2.20 (1.11–6.85) | 2.21 (1.08–7.90) | 2.17 (1.26–6.35) | 0.455 |
| Lesion diagnosis, n (%) | 0.887 | |||
| Benign | 187 (42.89) | 131 (42.67) | 56 (43.41) | |
| Malignant | 249 (57.11) | 176 (57.33) | 73 (56.59) | |
| Lesion characteristic, n (%) | 0.968 | |||
| Ground-glass | 15 (3.44) | 11 (3.58) | 4 (3.10) | |
| Solid | 334 (76.61) | 235 (76.55) | 99 (76.74) | |
| Cavitary | 87 (19.95) | 61 (19.87) | 26 (20.16) | |
| Location I, n (%) | 0.661 | |||
| Left lung | 216 (49.54) | 150 (48.86) | 66 (51.16) | |
| Right lung | 220 (50.46) | 157 (51.14) | 63 (48.84) | |
| Location II, n (%) | 0.855 | |||
| Hilus of lung | 21 (4.82) | 15 (4.89) | 6 (4.65) | |
| Upper lung | 220 (50.46) | 155 (50.49) | 65 (50.39) | |
| Middle lung | 19 (4.36) | 15 (4.89) | 4 (3.10) | |
| Lower lung | 176 (40.37) | 122 (39.74) | 54 (41.86) | |
| Lesion burr, n (%) | 0.776 | |||
| No | 258 (59.17) | 183 (59.61) | 75 (58.14) | |
| Yes | 178 (40.83) | 124 (40.39) | 54 (41.86) | |
| Distance from the closest vessel, n (%) | 0.573 | |||
| < 10 mm | 214 (49.08) | 148 (48.21) | 66 (51.16) | |
| ≥ 10 mm | 222 (50.92) | 159 (51.79) | 63 (48.84) | |
| CT-attenuation value, (HU) | 35.0 (28.0–43.0) | 36.0 (28.5–43.0) | 34.0 (27.0–42.0) | 0.065 |
| Lesion diameter, n (%) | 0.752 | |||
| 1–2 cm | 55 (12.61) | 38 (12.38) | 17 (13.18) | |
| 2–3 cm | 105 (24.08) | 77 (25.08) | 28 (21.71) | |
| ≥ 3 cm | 276 (63.30) | 192 (62.54) | 84 (65.12) | |
| Puncture distance, (mm) | 10.0 (0.0–20.0) | 10.0 (0.0–20.0) | 10.0 (0.0–20.0) | 0.737 |
| Procedure time, (min) | 10.0 (8.0–12.0) | 9.0 (8.0–12.0) | 10.0 (8.0–11.0) | 0.684 |
| Puncture times, median (IQR) | 1 (1–1) | 1 (1–2) | 1 (1–1) | 0.563 |
| Biopsy times, median (IQR) | 2 (2–2) | 2 (2–2) | 2 (2–2) | 0.105 |
| Puncture position, n (%) | 0.347 | |||
| Supine | 153 (35.09) | 113 (36.81) | 40 (31.01) | |
| Prone | 210 (48.17) | 141 (45.93) | 69 (53.49) | |
| Lateral position | 73 (16.74) | 53 (17.26) | 20 (15.50) |
Footnotes: SBP systolic blood pressure, DBP diastolic blood pressure, HR heart rate, SPO2 pulse oximetry saturation, COPD chronic obstructive pulmonary disease, CRP C-reactive protein, PT prothrombin time, SCC squamous cell carcinoma antigen, CEA carcinoembryonic antigen, NA not applicable
After analyzing the 309 patients in the derivation cohort, 29 variables were reduced to 5 potential predictors based on nonzero coefficients in the LASSO regression analysis (Fig. 1). These variables were: lesion diagnosis, lesion characteristics, lesion diameter, procedure time, and puncture distance.
Fig. 1.
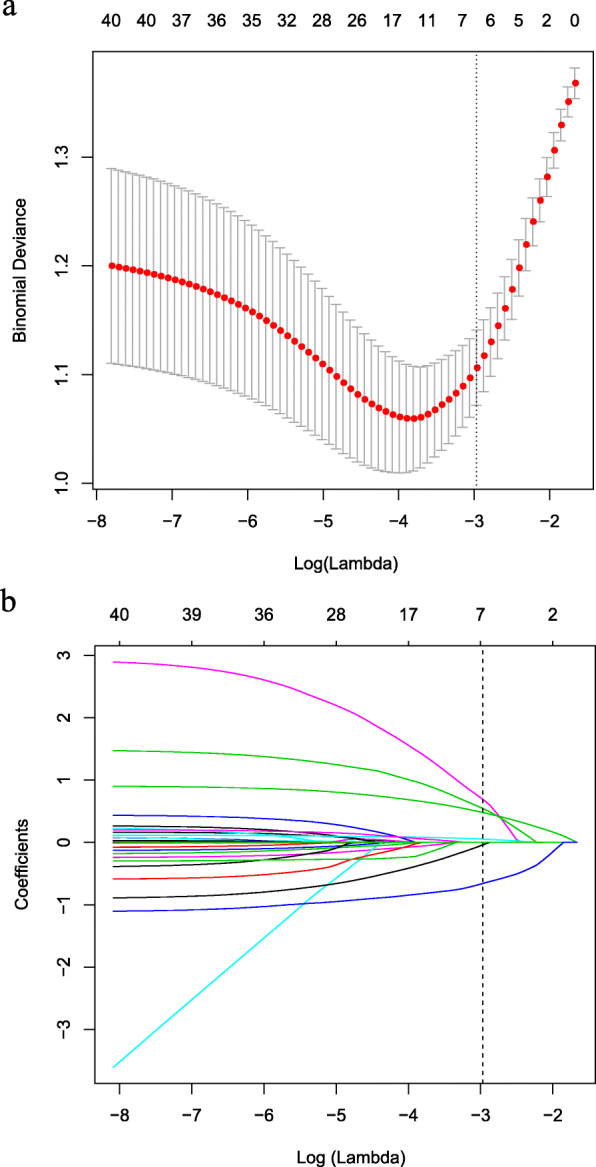
Predictors selection using the LASSO regression method with 10-fold cross-validation. Binomial deviance was plotted versus log (lambda) (a), and coefficients plots were produced against the log (lambda) sequence (b). A total of 29 variables were included in the LASSO regression method with 10-fold cross-validation. Dotted vertical lines in figures (a, b) were drawn at the optimal values by utilizing the 1-SE criteria, where five nonzero coefficients were filtered, and the corresponding five variables were lesion diagnosis, lesion characteristics, lesion diameter, procedure time, and puncture distance. These five variables were included in the predictive model. Footnotes: LASSO Least absolute shrinkage and selection operator, SE standard error
We established a risk prediction model for CT-TNB-induced hemoptysis based on the aforementioned 5 predictors, which independently associated with the risk of post-CT-TNB hemoptysis as assessed by logistic regression analysis (Table 2). As shown in Fig. 2, the AUC for the predictive model (black line) was 0.850 (95% CI, 0.808–0.893), while the AUC for the validation (red line) was 0.767 (95% CI, 0.684–0.851). The optimal cut-off value of ROC curve was 0.45 based on the maximum principle of Youden index, where it yielded an accuracy of 79.2%, a sensitivity of 76.3%, a specificity of 81.3%, a positive predictive value of 75.2%, and a negative predictive value of 82.2%.
Table 2.
Logistic regression analysis of each individual variable for the risk of hemoptysis following CT-TNB
| Variables | Odds ratio | 95% CI | P Value |
|---|---|---|---|
| Puncture distance | 2.375 | 1.882–2.997 | 0.000 |
| Lesion characteristic | |||
| Ground-glass | Ref. | ||
| Solid | 0.037 | 0.004–0.360 | 0.004 |
| Cavitary | 0.081 | 0.008–0.830 | 0.034 |
| Lesion diagnosis | |||
| Benign | Ref. | ||
| Malignant | 0.270 | 0.145–0.500 | 0.000 |
| Lesion diameter, (cm) | |||
| 1–2 | Ref. | ||
| 2–3 | 1.154 | 0.472–2.823 | 0.754 |
| ≥ 3 | 0.361 | 0.148–0.879 | 0.025 |
| Procedure time | 1.111 | 1.006–1.228 | 0.038 |
| Gender | |||
| Female | Ref. | ||
| Man | 0.754 | 0.450–1.264 | 0.284 |
| Age | 1.012 | 0.989–1.035 | 0.314 |
| SBP | 0.990 | 0.973–1.007 | 0.252 |
| DBP | 1.008 | 0.982–1.036 | 0.550 |
| HR | 0.991 | 0.971–1.010 | 0.342 |
| SPO2 | 1.044 | 0.883–1.234 | 0.651 |
| COPD | |||
| No | Ref. | ||
| Yes | 1.008 | 0.540–1.883 | 0.980 |
| Location I | |||
| Left lung | Ref. | ||
| Right lung | 1.208 | 0.737–1.977 | 0.454 |
| Location II | |||
| Hilus of lung | Ref. | ||
| Upper lung | 0.772 | 0.237–2.508 | 0.666 |
| Middle lung | 0.670 | 0.137–3.282 | 0.621 |
| Lower lung | 0.446 | 0.129–1.539 | 0.201 |
| Lesion burr | |||
| No | Ref. | ||
| Yes | 0.827 | 0.452–1.516 | 0.539 |
| Distance from the closest vessel | |||
| < 10 mm | |||
| ≥ 10 mm | 0.972 | 0.545–1.734 | 0.925 |
| CT-attenuation value | 1.002 | 0.986–1.018 | 0.798 |
| Puncture times | |||
| < 3 | Ref. | ||
| ≥ 3 | 3.048 | 0.590–15.757 | 0.184 |
| Biopsy times | 0.853 | 0.456–1.598 | 0.620 |
| Puncture position | |||
| Supine | |||
| Prone | 0.686 | 0.317–1.485 | 0.339 |
| Lateral position | 1.502 | 0.789–2.859 | 0.215 |
Footnotes: CT-TNB computed tomography-guided transthoracic needle biopsy, SBP systolic blood pressure, DBP diastolic blood pressure, HR heart rate, SPO2 pulse oximetry saturation, COPD chronic obstructive pulmonary disease
Fig. 2.
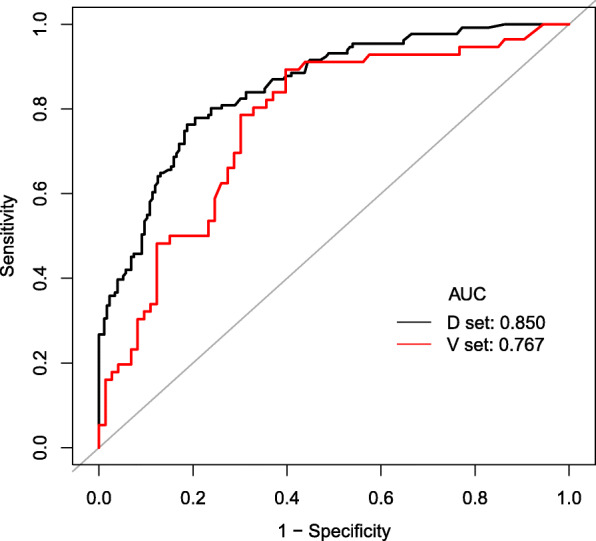
ROC curves of the predictive model in the derivation and validation datasets. The area under the ROC curve (black line) shows the predictive ability in the derivation cohort, and area under the ROC curve (red line) validates the predictive ability of the model. Footnotes: ROC receiver operating characteristic
To provide clinicians with a quantitative tool to predict the risk of post-CT-TNB hemoptysis, a nomogram was constructed based on the predictive model (Fig. 3). The calibration curve of the model for the risk of post-CT-TNB hemoptysis shows good consistency between prediction and observation in the derivation cohort. The unreliability test yielded a p-value of 0.994, with a Emax of 0.038 and a Eavg of 0.010, which indicated that there was no departure from a perfect fit (Fig. 4).
Fig. 3.

Nomogram for estimation of post-CT-TNB hemoptysis risk and its predictive performance. Lesion characteristic: 1: ground-glass, 2: solid, 3: cavitary; Diagnosis: 0: benign, 1: malignant; Lesion diameter: 1: 1-2 cm, 2: 2-3 cm, 3: ≥3 cm. Footnotes: CT-TNB computed tomography-guided transthoracic needle biopsy
Fig. 4.

Calibration curve of the predictive model. The Y-axis represents the actual post-CT-TNB hemoptysis rate. The X-axis represents the predicted risk of post-CT-TNB hemoptysis. The gray diagonal line represents the ideal model, which means that the predicted value is completely consistent with the actual observation result. The dotted line represents the prediction model established in this study. A closer fit to the gray diagonal line represents a better prediction. In the unreliability test, it yielded a p-vale of 0.994, a Emax value of 0.038, and a Eavg value of 0.010, which indicates that there was no departure from a perfect fit of the calibration between our model and the ideal model. Footnotes: CT-TNB computed tomography-guided transthoracic needle biopsy
The decision curve for the model and that for the validation is presented in Fig. 5. DCA revealed that when the threshold probability of an individual was ≥10% (in the derivation cohort, Fig. 5a) or between 5 and 90% (in the validation cohort, Fig. 5b), application of this model to predict the risk of post-CT-TNB hemoptysis would add net benefit than applying either the treat-all or treat-none strategies.
Fig. 5.

Decision curve analysis for the predictive model and the validation. The Y-axis measures the net benefit. The dashed line represents the model. The black line represents the assumption that all patients have post-CT-TNB hemoptysis, and the orange line represents the assumption that no patients have post-CT-TNB hemoptysis. The decision curve shows that when the threshold probability of a patient is ≥10% (a) or between 5 and 90% (b), applying this model to predict post-CT-TNB hemoptysis adds more benefit than either the treat-all or the treat-none strategies. Footnotes: CT-TNB computed tomography-guided transthoracic needle biopsy
Discussion
In the present study, we developed and validated a risk prediction model for hemoptysis following CT-TNB. This predictive model incorporates five variables: diagnosis of the lesion, lesion characteristics, lesion diameter, procedure time, and puncture distance. The model showed good discrimination predictive ability (AUC: 0.850). We also constructed a nomogram based on these five variables to facilitate the individualized prediction of post-CT-TNB hemoptysis.
In the last few decades, the detection rate of lung lesions has increased, especially in the case of asymptomatic pulmonary nodules and masses [9]. To obtain a pathological diagnosis, several techniques (e.g. CT, endobronchial ultrasound, and virtual bronchoscopic navigation) have been applied for guidance during the biopsy procedure. However, CT-TNB currently remains a frequently used method in clinical practice [6, 10]. Reportedly, the main complications of CT-TNB include hemoptysis, pneumothorax, hemothorax, air embolism, and infection [4, 11, 12]. The incidence of post-CT-TNB hemoptysis, based on different study populations and the type of needle used, varies between 0.5 and 14.4%, and the rate of post-CT-TNB intrapulmonary hemorrhage is 2.9–54.5% [4, 5]. In our study, the incidence of hemoptysis was as high as 42.9%. We speculate that the following factors may have contributed to the high hemoptysis rate. First, we used an 18-gauge coaxial needle rather than fine needle aspiration to perform the biopsies, and it has been reported that the rate of hemoptysis is higher for core biopsies than when fine needle aspiration is used [5]. Second, 96% (418/436) of the patients in our study were subjected to two or more biopsies. Third, 43% (187/436) of the lesions were benign and 39% (172/436) were non-nodular lesions, and more biopsies and larger-gauge needles are recommended when trying to confirm a benign diagnosis [13]. Finally, but most importantly, we defined blood in sputum as hemoptysis in the present study.
There are a number of studies focusing on post-CT-TNB hemoptysis complications [14–16]. However, to our knowledge, no prediction models for CT-TNB-induced hemoptysis have been previously reported. Severe hemoptysis can be life-threatening, and this complication in outpatients would be even more significant. Therefore, it would be helpful for predicting the risk of post-CT-TNB hemoptysis. In this study, we established a risk prediction model based on 5 variables determined by LASSO regression analysis. Regression shrinkage and selection via the LASSO method were first reported by Robert in 1996 [17], and this approach is considered superior to the method of choosing predictors according to the strength of their univariable association with the outcome, especially when there are a large number of variables [18, 19]. All these 5 predictors are easily available clinically. In addition, our prediction model showed both good discrimination ability and calibration.
With regard to its clinical usefulness, we performed DCA to assess whether clinical decisions taken based on this proposed model would improve patient outcomes. DCA, based on different threshold probabilities, could provide insight into the consequences of clinical decisions for clinicians [8, 20, 21]. The DCA based on our model is excellent. It shows that if the threshold probability of an individual was ≥10%, applying the model to predict post-CT-TNB hemoptysis would add a net benefit. Therefore, this model would be useful in the management of post-CT-TNB outpatients. On the one hand, it could reduce patient postoperative anxiety, which induced by post-CT-TNB hemoptysis. On the other hand, it will help physicians screen patients who have a high risk of postoperative hemoptysis, extend their postoperative observation, and provide timely treatment when necessary.
Our study had several major limitations. Firstly, it was a single-center and retrospective evaluation. Although we carried out a validation test of the model, additional independent external verification is warranted to confirm its utility in clinical practice. Secondly, we did not include quantitative measurement of the volume of hemoptysis; therefore, this model can only be used to predict post-CT-TNB hemoptysis, not to distinguish the severity of the hemoptysis. Thirdly, some variables with potential predictive value may help to improve the discrimination ability of the model, such as morphological characteristics of blood vessels, blood flow directions, vessel diameters, local blood pressure and shear stress distribution of all the vessels that involved along the punching pass; however, they were not available in the retrospective data.
Conclusion
We established a predictive post-CT-TNB hemoptysis model based on 5 predictors. This model not only showed good discrimination ability and calibration characteristics but also demonstrated excellent clinical application potential, as determined by DCA. Therefore, this predictive model may be of great value to facilitate the individualized preoperative prediction of post-CT-TNB hemoptysis.
Acknowledgements
We appreciate the help and support of all the participants involved in the study.
Abbreviations
- CT-TNB
Computed tomography-guided transthoracic needle biopsy
- COPD
Chronic obstructive pulmonary disease
- LASSO
Least absolute shrinkage and selection operator
- AUROC
Area under the receiver operating characteristic curve
- DCA
Decision curve analysis
- CI
Confidence interval
Authors’ contributions
SW contributed substantially to the study design, data analysis and interpretation, the writing of the manuscript, and takes responsibility for the integrity of the data and the accuracy of the data analysis. KD contributed to data collected, data analysis, data interpretation. WC contributed to data interpretation and manuscript revision. All authors have read and approved the manuscript.
Funding
This study was supported by the Science and Technology Project of Jinhua City (2020XG-15, 2020–4-013). Jinhua Science and Technology Bureau provided funding but had no role in study design or collection, analysis or interpretation, nor in writing of the manuscript.
Availability of data and materials
The datasets used and/or analyzed during the current study are available from the corresponding author on reasonable request.
Ethics approval and consent to participate
The study was approved by the ethics committee of Jinhua Hospital of Zhejiang University. All patient information was handled anonymously and informed consent was therefore waived.
Consent for publication
Not applicable.
Competing interests
The authors declare no conflicts of interest.
Footnotes
Publisher’s Note
Springer Nature remains neutral with regard to jurisdictional claims in published maps and institutional affiliations.
Contributor Information
Saibin Wang, Email: saibinwang@hotmail.com.
Wei Chen, Email: chenwei_008008@163.com.
References
- 1.Kauczor HU, Bonomo L, Gaga M, Nackaerts K, Peled N, Prokop M, et al. ESR/ERS white paper on lung cancer screening. Eur Respir J. 2015;46(1):28–39. doi: 10.1183/09031936.00033015. [DOI] [PMC free article] [PubMed] [Google Scholar]
- 2.Moyer VA. U.S. preventive services task force. Screening for lung cancer: U.S. preventive services task force recommendation statement. Ann Intern Med. 2014;160(5):330–338. doi: 10.7326/M13-2771. [DOI] [PubMed] [Google Scholar]
- 3.National Lung Screening Trial Research Team. Church TR, Black WC, Aberle DR, Berg CD, Clingan KL, et al. Results of initial low-dose computed tomographic screening for lung cancer. N Engl J Med. 2013;368(21):1980–1991. doi: 10.1056/NEJMoa1209120. [DOI] [PMC free article] [PubMed] [Google Scholar]
- 4.Han Y, Kim HJ, Kong KA, Kim SJ, Lee SH, Ryu YJ, et al. Diagnosis of small pulmonary lesions by transbronchial lung biopsy with radial endobronchial ultrasound and virtual bronchoscopic navigation versus CT-guided transthoracic needle biopsy: a systematic review and meta-analysis. PLoS One. 2018;13(1):e0191590. doi: 10.1371/journal.pone.0191590. [DOI] [PMC free article] [PubMed] [Google Scholar]
- 5.Heerink WJ, de Bock GH, de Jonge GJ, Groen HJ, Vliegenthart R, Oudkerk M. Complication rates of CT-guided transthoracic lung biopsy: meta-analysis. Eur Radiol. 2017;27(1):138–148. doi: 10.1007/s00330-016-4357-8. [DOI] [PMC free article] [PubMed] [Google Scholar]
- 6.Boskovic T, Stanic J, Pena-Karan S, Zarogoulidis P, Drevelegas K, Katsikogiannis N, et al. Hemoptysis after transthoracic needle biopsy of lung lesions under CT guidance. J Thorac Dis. 2014;6(Suppl 1):S99–S107. doi: 10.3978/j.issn.2072-1439.2013.12.08. [DOI] [PMC free article] [PubMed] [Google Scholar]
- 7.Wang S, Tu J, Dong K. Nomogram to predict postoperative PR in patients undergoing CT-guided transthoracic lung biopsy. J Thorac Dis. 2019;11(4):1705–1713. doi: 10.21037/jtd.2019.01.60. [DOI] [PMC free article] [PubMed] [Google Scholar]
- 8.Vickers AJ, Cronin AM, Elkin EB, Gonen M. Extensions to decision curve analysis, a novel method for evaluating diagnostic tests, prediction models and molecular markers. BMC Med Inform Decis Mak. 2008;8:53. doi: 10.1186/1472-6947-8-53. [DOI] [PMC free article] [PubMed] [Google Scholar]
- 9.Wahidi MM, Govert JA, Goudar RK, Gould MK. McCrory DC; American College of Chest Physicians. Evidence for the treatment of patients with pulmonary nodules: when is it lung cancer?: ACCP evidence-based clinical practice guidelines (2nd edition) Chest. 2007;132(3 Suppl):94S–107S. doi: 10.1378/chest.07-1352. [DOI] [PubMed] [Google Scholar]
- 10.Manhire A, Charig M, Clelland C, Gleeson F, Miller R, Moss H, et al. Guidelines for radiologically guided lung biopsy. Thorax. 2003;58(11):920–936. doi: 10.1136/thorax.58.11.920. [DOI] [PMC free article] [PubMed] [Google Scholar]
- 11.Tomiyama N, Yasuhara Y, Nakajima Y, Adachi S, Arai Y, Kusumoto M, et al. CT-guided needle biopsy of lung lesions: a survey of severe complication based on 9783 biopsies in Japan. Eur J Radiol. 2006;59(1):60–64. doi: 10.1016/j.ejrad.2006.02.001. [DOI] [PubMed] [Google Scholar]
- 12.Wang S, Tu J, Chen W. Development and validation of a prediction pneumothorax model in CT-guided transthoracic needle biopsy for solitary pulmonary nodule. Biomed Res Int. 2019;2019:7857310. doi: 10.1155/2019/7857310. [DOI] [PMC free article] [PubMed] [Google Scholar]
- 13.Yankelevitz DF, Vazquez M, Henschke CI. Special techniques in transthoracic needle biopsy of pulmonary nodules. Radiol Clin N Am. 2000;38(2):267–279. doi: 10.1016/S0033-8389(05)70162-7. [DOI] [PubMed] [Google Scholar]
- 14.Laurent F, Latrabe V, Vergier B, Michel P. Percutaneous CT-guided biopsy of the lung: comparison between aspiration and automated cutting needles using a coaxial technique. Cardiovasc Intervent Radiol. 2000;23(4):266–272. doi: 10.1007/s002700010067. [DOI] [PubMed] [Google Scholar]
- 15.Braak SJ, Herder GJ, van Heesewijk JP, van Strijen MJ. Pulmonary masses: initial results of cone-beam CT guidance with needle planning software for percutaneous lung biopsy. Cardiovasc Intervent Radiol. 2012;35(6):1414–1421. doi: 10.1007/s00270-011-0302-z. [DOI] [PubMed] [Google Scholar]
- 16.Loubeyre P, Copercini M, Dietrich PY. Percutaneous CT-guided multisampling core needle biopsy of thoracic lesions. AJR Am J Roentgenol. 2005;185(5):1294–1298. doi: 10.2214/AJR.04.1344. [DOI] [PubMed] [Google Scholar]
- 17.Tibshirani R. Regression shrinkage and selection via the LASSO. J R Stat Soc Ser B Methodol. 1996;58(1):267–288. [Google Scholar]
- 18.Huang YQ, Liang CH, He L, Tian J, Liang CS, Chen X, et al. Development and validation of a radiomics nomogram for preoperative prediction of lymph node metastasis in colorectal cancer. J Clin Oncol. 2016;34(18):2157–2164. doi: 10.1200/JCO.2015.65.9128. [DOI] [PubMed] [Google Scholar]
- 19.Tibshirani R. The lasso method for variable selection in the cox model. Stat Med. 1997;16(4):385–395. doi: 10.1002/(SICI)1097-0258(19970228)16:4<385::AID-SIM380>3.0.CO;2-3. [DOI] [PubMed] [Google Scholar]
- 20.Vickers AJ, Elkin EB. Decision curve analysis: a novel method for evaluating prediction models. Med Decis Mak. 2006;26(6):565–574. doi: 10.1177/0272989X06295361. [DOI] [PMC free article] [PubMed] [Google Scholar]
- 21.Balachandran VP, Gonen M, Smith JJ, DeMatteo RP. Nomograms in oncology: more than meets the eye. Lancet Oncol. 2015;16(4):e173–e180. doi: 10.1016/S1470-2045(14)71116-7. [DOI] [PMC free article] [PubMed] [Google Scholar]
Associated Data
This section collects any data citations, data availability statements, or supplementary materials included in this article.
Data Availability Statement
The datasets used and/or analyzed during the current study are available from the corresponding author on reasonable request.