Fig. 2.
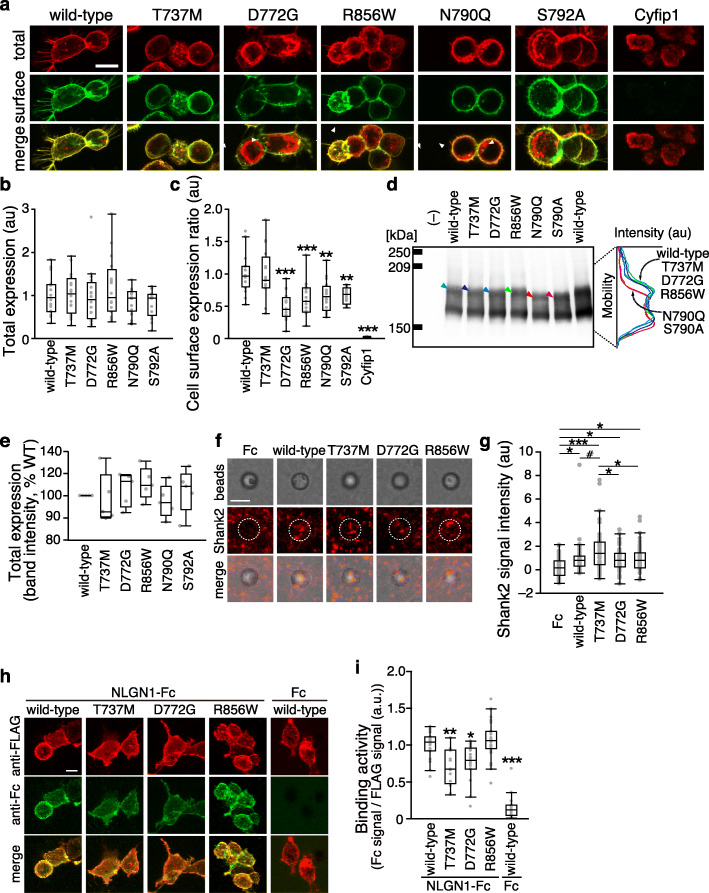
Impact of T737M, D772G, and R856W variants on cell surface expression, synaptogenic activity, and NLGN1 interaction of NRXN1α. a Representative images of HEK293T cells expressing wild-type and disease-associated variants of NRXN1α tagged with FLAG epitope. Cell surface and total NRXN1α are shown in green and red, respectively. FLAG-tagged cyfip1, a cytoplasmic protein, serves as a negative control. Arrowheads indicate intracellular accumulation of NRXN1α protein. b and c Total expression levels (b) and ratios of cell surface and total expression levels (c) of wild-type and disease-associated variants of NRXN1α in a (n = 16 HEK293T cells each). d Western blot analysis of lysates from HEK293T cells expressing FLAG-tagged NRXN1α variants. Densitographes for each lane are shown on the left. Each densitograph is derived from the lane with an arrowhead of the same color. e Total expression levels of FLAG-tagged wild-type and disease-associated variants of NRXN1α measured by band intensity of Western blots in d (n = 5 independent experiments). Excitatory postsynapse-inducing activities of wild-type and disease-associated (f) variants of NRXN1α were monitored by Shank2 immunostaining of co-cultures of cortical neurons and beads conjugated with Fc or NRXN1α variants fused to Fc (middle row, red). Corresponding differential interference contrast images and merged images are shown on the top and bottom rows, respectively. g Intensity of staining signals for Shank2 on NRXN1α-Fc beads (n = 44–62 beads). h Binding of the extracellular domain of NLGN1 fused to Fc to HEK293T cells transfected with FLAG-tagged NRXN1α variants (red). Cell surface-bound Fc fusion proteins were visualized using anti-Fc antibody (green). i Ratios of staining signals for NLGN1-Fc and FLAG-tagged NRXN1α variants in h (n = 13–27 HEK293T cells). Scale bars, 10 μm in a and h, and 5 μm in f. All data are presented as box plots. Horizontal line in each box shows median, box shows the interquartile range (IQR), and the whiskers are 1.5× IQR. #p < 0.1, *p < 0.05, **p < 0.01, and ***p < 0.001, Tukey’s test, in comparison with wild-type NRXN1α-expressing cells in c and i, and in all the comparisons in g

