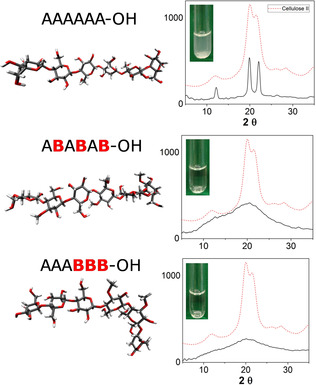
Figure 15.

Representative conformations of a cellulose oligomer (A6) and two methylated analogues obtained from MD simulations. Powder XRD analysis and solubility test show differences in the aggregations of these compounds. The chemical structure of the monosaccharides A and B is reported in Figure 14. Reproduced from Ref. 67. Copyright, 2019, The Authors. Published by Wiley‐VCH Verlag GmbH & Co. KGaA.
