
FIGURE 1.
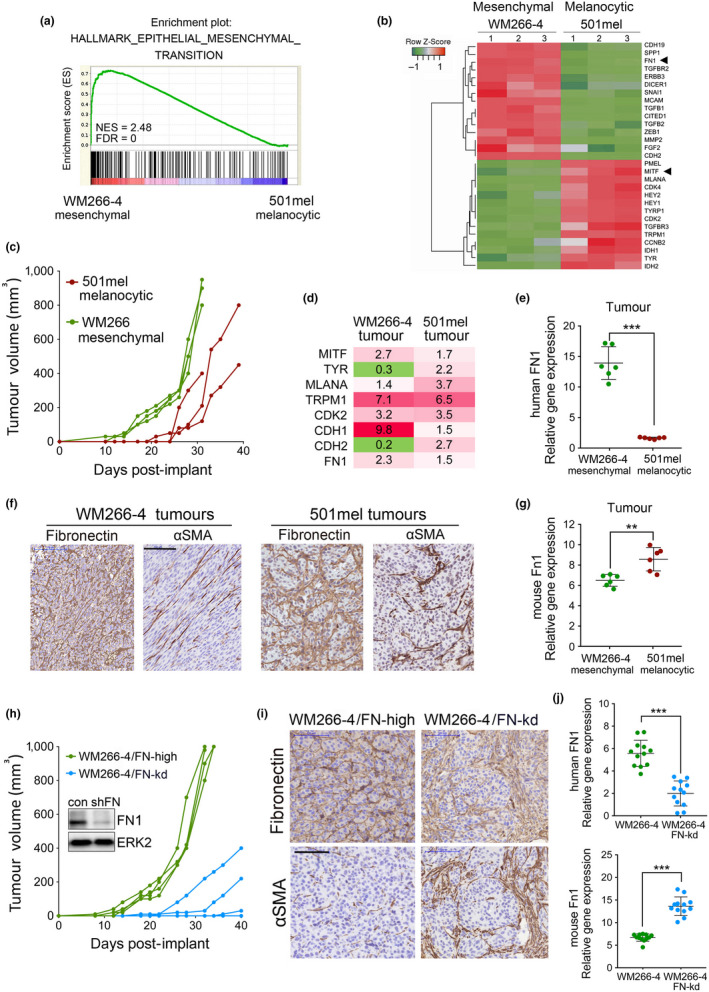
FN1 accelerates the onset of melanoma growth. (a) GSEA plot of EMT Hallmark (Liberzon et al., 2015) for 501mel‐mCherry and WM266‐4‐GFP cells. (b) Expression heatmap showing gene subset with the highest up‐ and down‐regulation in 501mel‐mCherry versus WM266‐4‐GFP cells. (c) Tumour volumes over 31 days in mice (n = 3 mice/group) injected with 501mel‐mCherry and WM266‐4‐GFP cells. (d) Fold change in mRNA expression in indicated tumours when compared to cell lines. (e) qRT‐PCR analysis of human FN1 expression in indicated tumours. (f) IHC for fibronectin and αSMA in indicated tumours. Scale bar: 100 µm. (g) qRT‐PCR analysis of mouse Fn1 expression as in (e). (h) Tumour volumes over a period of 40 days in mice (n = 4 mice/group) injected with WM266‐4‐GFP or WM266‐4 FN‐kd‐GFP cells. Expression of FN1 in both cell lines was analysed by Western blotting. ERK2 served as loading control. (i) IHC for fibronectin and αSMA in WM266‐4‐GFP tumours (day 32) and WM266‐4 FN‐kd‐GFP tumours (day 40). Scale bar: 100 µm. (j) qRT‐PCR analysis of human FN1 and mouse Fn1 expression in the respective tumours. **p < .01; ***p < .001, for GSEA: FDR < 0.0001