FIGURE 2.

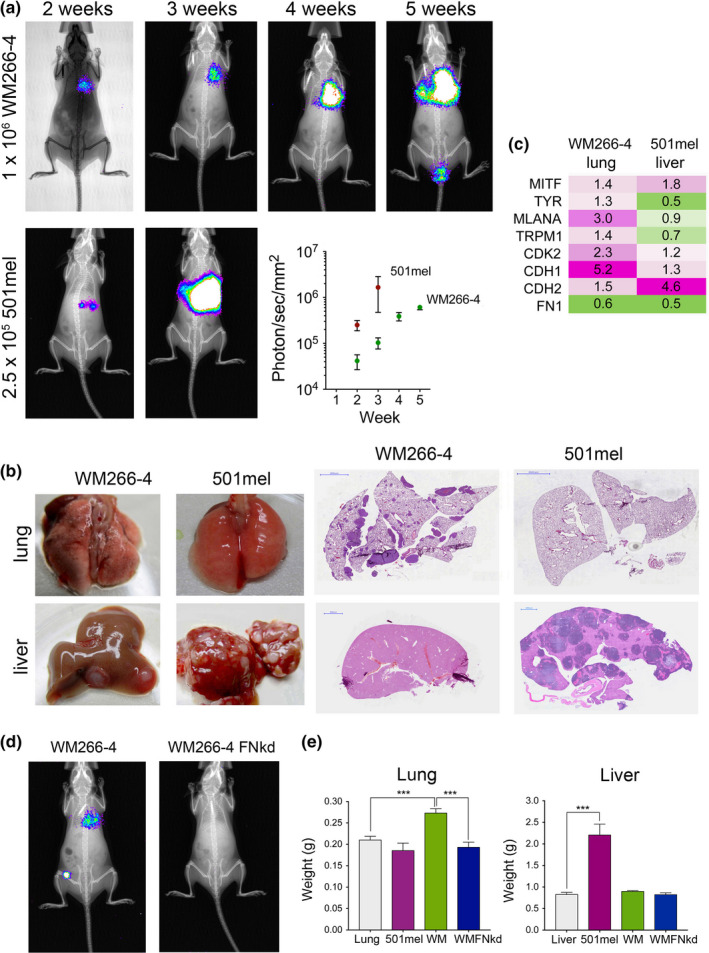
Mesenchymal and melanocytic melanoma cells seed metastases. (a) Representative images of in vivo bioluminescence imaging in NSG mice injected i.v. with luciferase expressing WM266‐4‐GFP or 501mel‐mCherry cells. Quantitation of imaging signals of serial images is shown (n = 4 mice/group). (b) Photographs and H&E staining of livers and lungs isolated from mice described in (a). Scale bar: 2000 µm. (c) qRT‐PCR analysis of indicated genes and in indicated cell lines and corresponding metastases. The mean fold change (n = 3) is indicated, cut‐off p < .05. (d) Representative images of in vivo bioluminescence imaging of metastases in NSG mice injected IV with luciferase expressing WM266‐4‐GFP or WM266‐4 FN‐kd‐GFP cells (n = 3 mice/group). (e) Lung and liver weights from mice injected with the indicated cell lines (n = 3 mice/group). Normal lungs and livers served as control. One‐way ANOVA, ***p < .001
