
Figure 9.
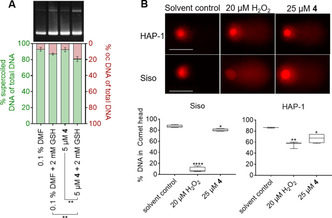
A) Supercoiled plasmid cleavage by compound 4 or the respective solvent DMF in the absence and presence of GSH, displayed as ratios of supercoiled (left y‐axis) and open circular (right y‐axis) plasmid DNA. Data from three independent replicates were compared by two‐tailed unpaired t‐test (n=3; **p<0.01). B) Above: Representative images of comets in HAP‐1 and SISO cells exposed to either 1 % DMF as solvent, H2O2 or 4 for 15 min at 0 °C. Scale bar: 50 μm. Below: Box and‐whiskers plot displaying the percentage of intact genomic DNA in the comet head after various treatments. One‐way ANOVA and Dunnett's multiple comparisons tests were performed relative to the solvent control (n≥3; *p<0.05; **p<0.01; ****p<0.0001).