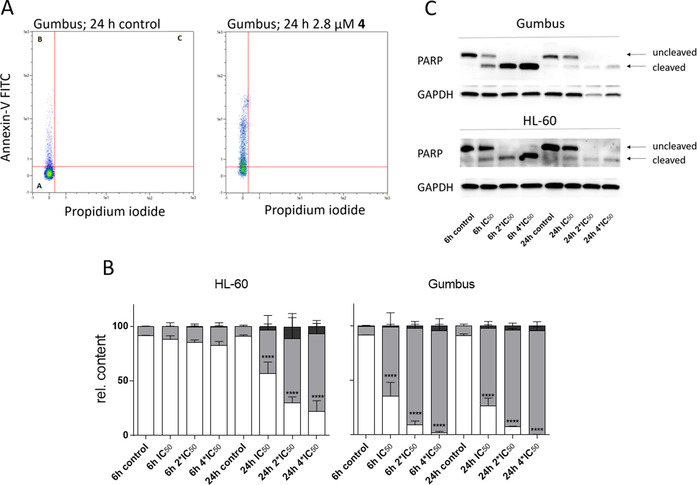
Figure 10.

A) Representative flow cytometric plots of Annexin‐V/PI‐labeled Gumbus cells, with and without exposure to 2.8 μM 4 for 24 h (population in quadrant I: living cells; II: apoptotic cells; III: late apoptotic/necrotic cells), B) Results of cytometric studies with Annexin‐V/PI‐labeled HL‐60 and Gumbus cells treated with 4 at multiple concentrations of the viability IC50 for 6 or 24 h; living cells (white), early apoptotic cells (gray), late apoptotic/necrotic cells (black; mean+SD, n=3, ****p<0.0001); C) Detection of PARP cleavage by western blotting in Gumbus and HL‐60 cells after incubation with various concentrations of 4 for 6 or 24 h.
