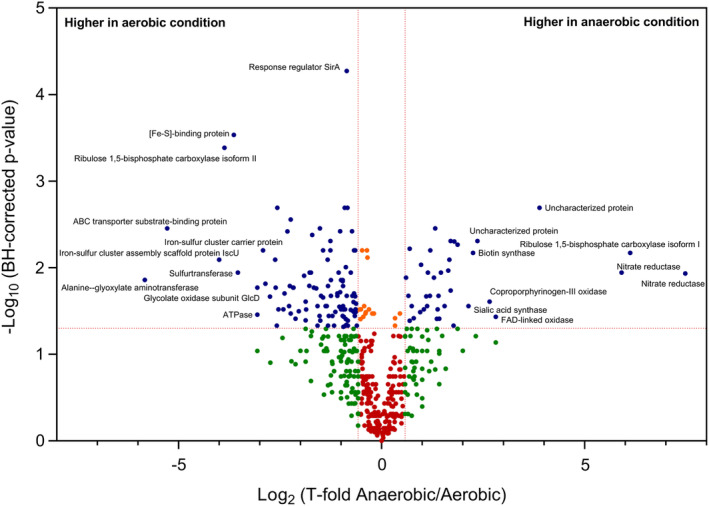
Figure 2.

Volcano plot representing univariate analysis of PXD013243 shotgun proteomics data set (anaerobic versus aerobic conditions). The thresholds set were at least 1.5 for the fold change and below 0.05 for the BH‐corrected P‐value. Blue dots indicate proteins that satisfy both statistical filters. Orange dots indicate proteins that satisfy only the confidence threshold but have a low fold change. Green dots are proteins that satisfy the fold‐change cut‐off but are not statistically significant. Red dots represent the proteins not satisfying either criterion.
