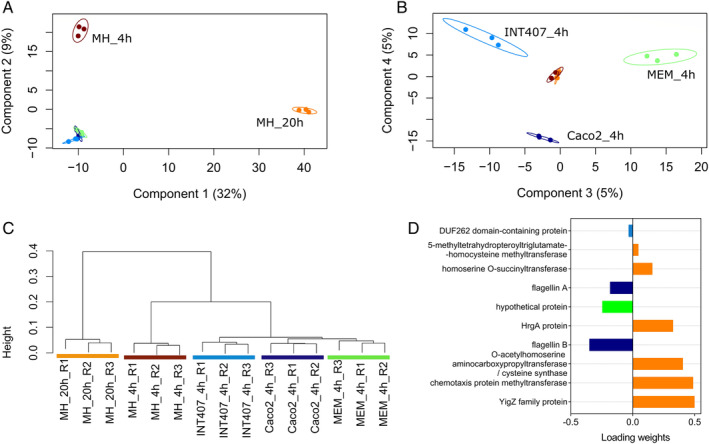
Figure 3.

Multivariate analysis of PXD009817 shotgun proteomics data set. A. Sample PLS‐DA plot with 95% confidence ellipses on components 1 and 2. B. Sample PLS‐DA plot with 95% confidence ellipses on components 3 and 4. C. Non‐supervised hierarchical clustering of samples based on the features selected from the sPLS‐DA analysis (subset of 424 proteins). D. Loading plot showing 10 most discriminating proteins on component 1, with colour indicating the condition with a maximal mean abundance value for each protein.
