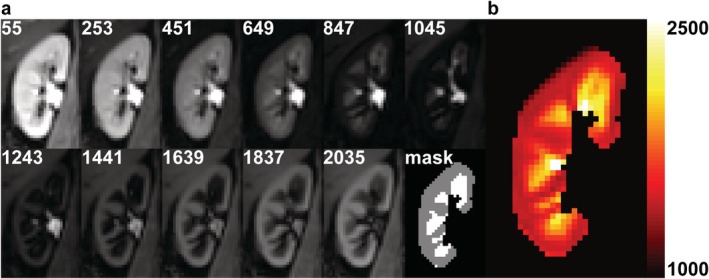
Figure 3.

Example images of the right kidney from a healthy volunteer obtained at the first scan session. (a) T1 source images at multiple inversion times (in msec) after motion correction and the masks of the cortical and medullary segmentation. (b) Calculated corresponding T1 map. The color bar indicates T1 relaxation time in msec. Cortex and medulla can easily be discriminated thanks to the higher T1 in medulla compared to cortex.
