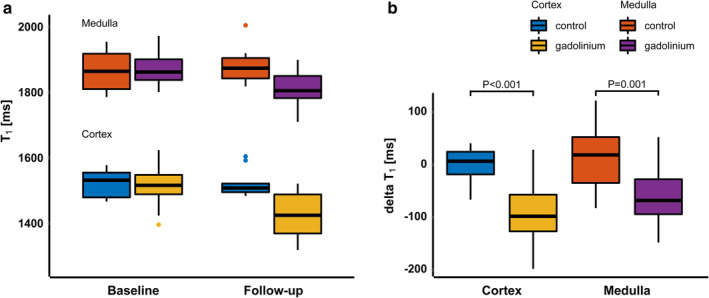
Figure 4.

(a) Boxplots summarizing the T1 values in the gadolinium (n = 16) and control group (n = 5) at baseline and follow‐up. (b) boxplots of the ΔT1 for cortex and medulla and both for the gadolinium and control group. ΔT1 in the gadolinium group differed significantly from ΔT1 in the control group, both in cortex (P < 0.001) and medulla (P = 0.001).
