
Figure 5.
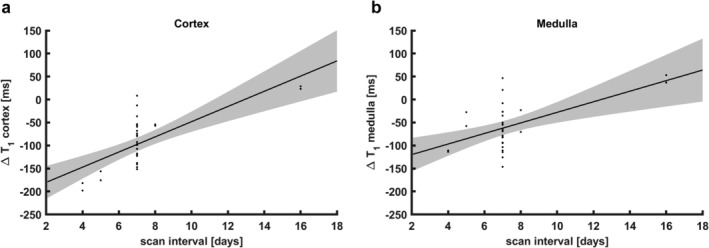
Regression analysis of the dependence of ΔT1 on scan interval in the gadolinium group (n = 16). Shaded areas denote the 95% confidence interval of the regression line. (a) Cortical ΔT1 values, R2 0.49, P < 0.001. (b) Medullary ΔT1 values, R2 0.30, P < 0.001.