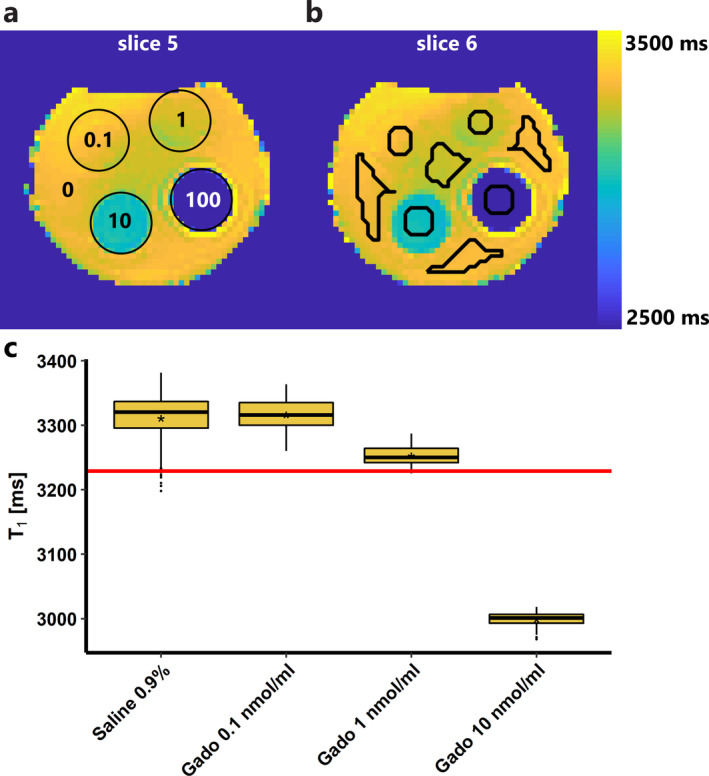
Figure 7.

Results of phantom experiment. (a,b) T1 maps of the two middle slices of the phantom. T1 values across the phantom are not completely homogeneous due to inhomogeneity of the magnetic field. (a) The different tubes are denoted with circles and the gadobutrol concentrations are given in nmol/mL. The tubes are surrounded by saline 0.9%, denoted with a 0 (0 nmol/mL gadobutrol). (b) The ROIs (black lines) were drawn manually, carefully avoiding partial volume and susceptibility artifacts. (c) Boxplots of the T1 distribution inside each ROI. The mean is denoted with an asterisk (*). The red line denotes the detection limit; it corresponds to a concentration of 2.5 nmol/mL gadobutrol.
