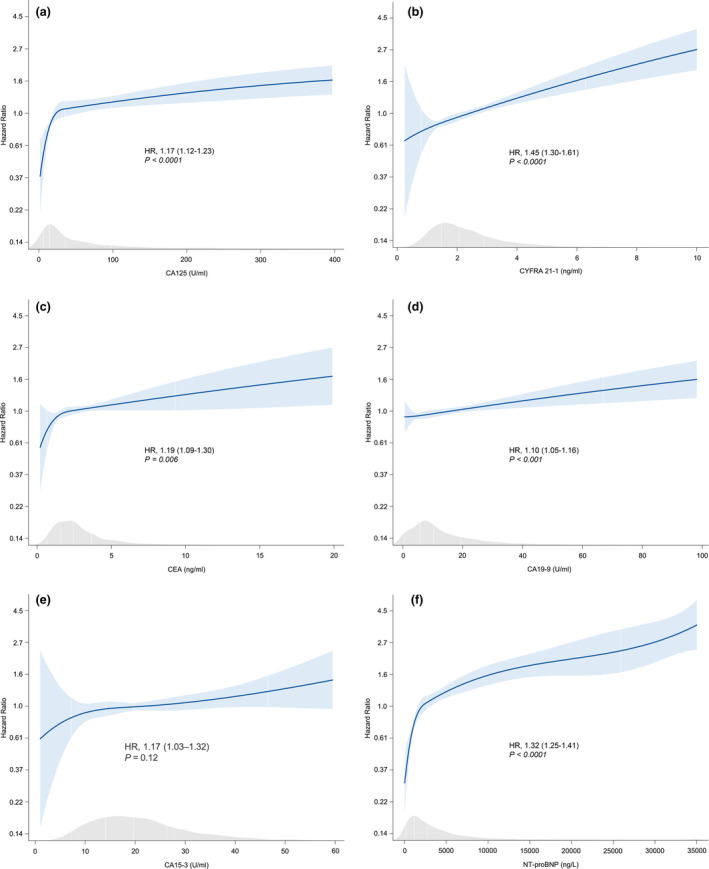
Fig. 1.

Cox regression models, estimating the predictive value of tumour markers and NT‐proBNP for all‐cause mortality. (a) CA125. (b) CYFRA 21‐1. (c) CEA. (d) CA19‐9. (e) CA15‐3. (f) NT‐proBNP. The P‐values presented are Bonferroni‐adjusted. HR: hazard ratio. Numbers between brackets represent the 95% CI. All models are corrected for the BIOSTAT risk model (including age, BUN, NT‐proBNP (except for NT‐proBNP), haemoglobin and beta blocker use at baseline).
