
Figure 4.
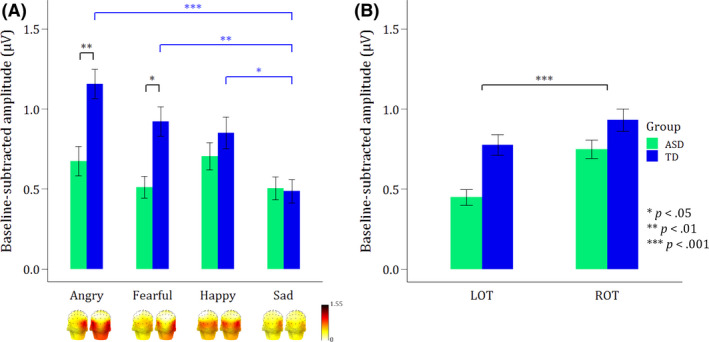
Bar graphs of the summed baseline‐subtracted amplitudes of both groups for the first four oddball harmonics (until 4.8 Hz) displaying mean expression‐discrimination responses. Error bars reflect standard errors of the mean. (A) Scalp topographies and bar graphs (averaged across LOT and ROT regions) displaying the mean responses per expression. The Group x Expression interaction shows significantly lower responses in the ASD versus TD group for angry and fearful faces (black asterisks), and an overall lower response to sad faces as compared to the other expressions in TDs (blue asterisks). (B) The main effect of ROI revealed a right hemisphere advantage, with significantly higher responses in ROT versus LOT region [Colour figure can be viewed at wileyonlinelibrary.com]