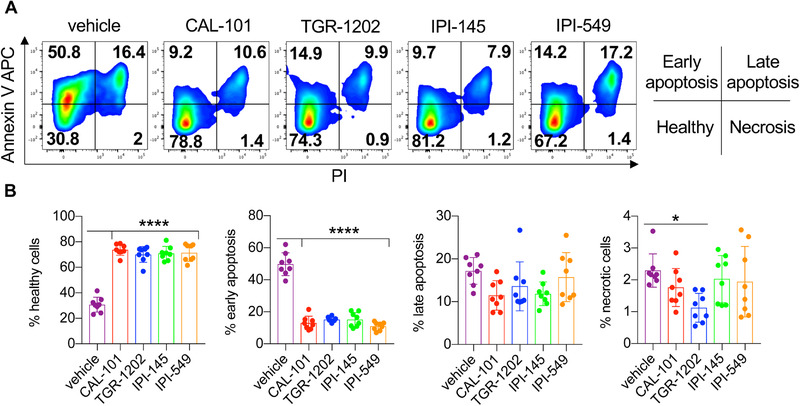
Figure 5.

Inhibitor‐treated CD8+ T cells are resistant to activation‐induced cell death. Day 7 CD8+ pmel‐1 cells were stimulated overnight with plate bound anti‐CD3 in inhibitor‐free media. (A) Representative flow cytometry plots of CD8+ T cells and (B) proportions of cells in apoptotic stages as defined by Annexin V and PI staining. Data analyzed by one‐way ANOVA with Tukey's multiple comparisons with n = 8 mice/group from two independent experiments. All bars represent the mean ± the SD with statistical significance as p < 0.05*, p < 0.01**, p < 0.001***, and p < 0.0001****.
