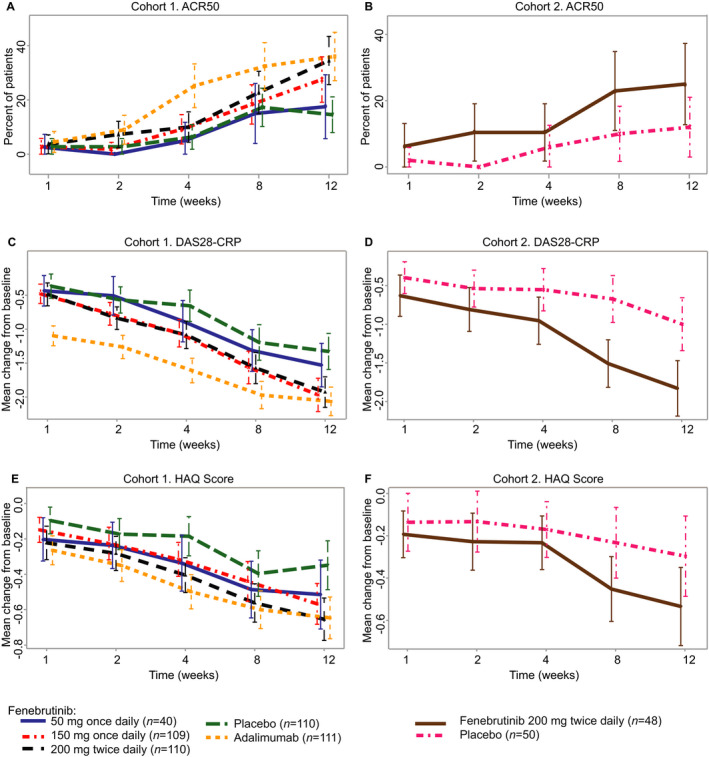
Figure 2.

Secondary end point efficacy data over time up to week 12. A and B, American College of Rheumatology 50% improvement criteria (ACR50) response at the indicated time points in each treatment group in the cohort of rheumatoid arthritis (RA) patients with an inadequate response to methotrexate (cohort 1) (A) and the cohort of RA patients with an inadequate response to tumor necrosis factor inhibitors (cohort 2) (B). C and D, Change from baseline in the 4‐variable Disease Activity Score using the C‐reactive protein level (DAS28‐CRP) at the indicated time points in each treatment group in cohort 1 (C) and cohort 2 (D). E and F, Change from baseline in the Health Assessment Questionnaire (HAQ) disability index score at the indicated time points in each treatment group in cohort 1 (E) and cohort 2 (F). In A and B, values are the proportion of ACR50 responders and 95% confidence interval (95% CI); in C–F, values are the mean change from baseline and 95% CI. In C–F, change from baseline was not adjusted for the randomization stratification factor, “geographic region.”
