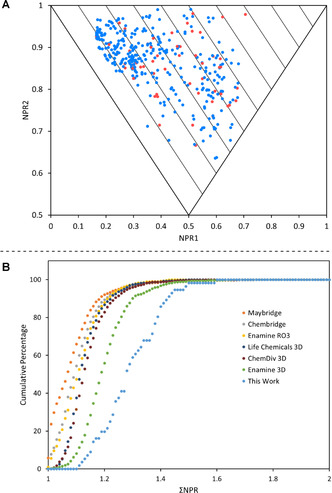
Figure 3.

A: PMI plot of the final fragment collection. Red dots indicate global minimum energy conformers and blue dots indicate higher energy conformers. B: Cumulative PMI analysis of the fragment collection (light blue) along with six commercially available libraries.
