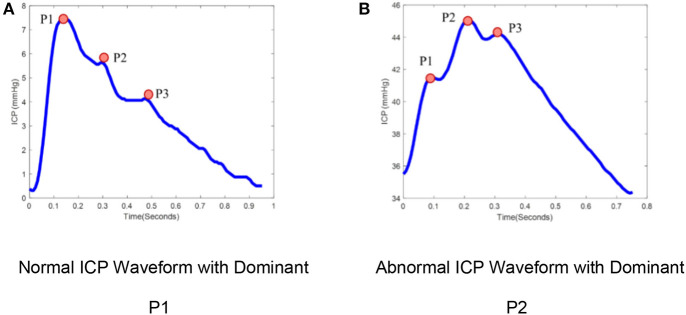
Figure 1.
ICP pulse morphology: (A) Normal ICP Waveform with dominant P1, (B) Abnormal ICP waveform with dominant P2. ICP waveforms during normal intracranial physiologic conditions (A) differ from waveforms recorded when brain compliance is reduced (B). The waveform (A) represents the dominant P1 with amplitude P1 > P2 > P3 while waveform (B) represent the dominant P2 with amplitude P2 > P1, P3.

