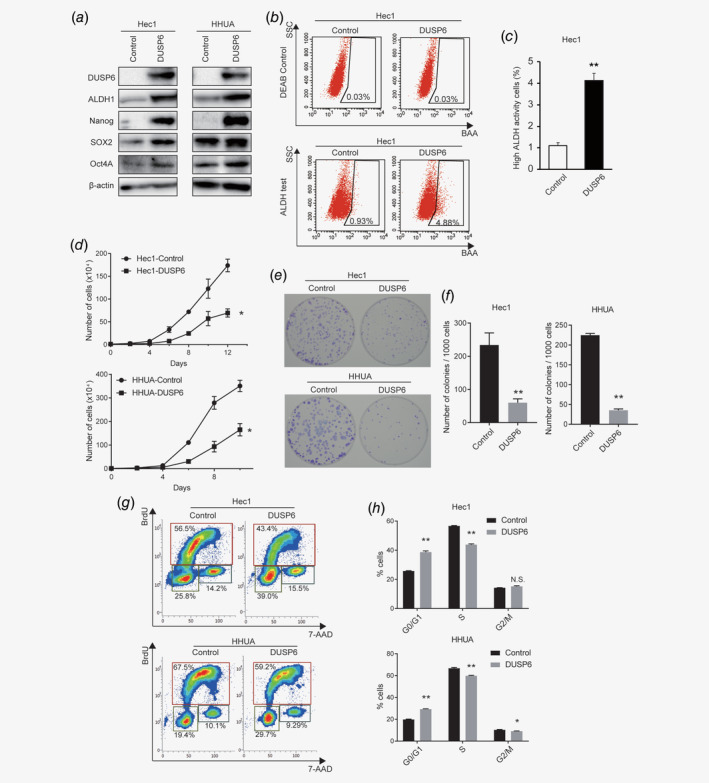
Figure 1.

DUSP6 increases expression of CSC‐related genes and the number of cells in the G0/G1 phase. (a) Western blot analysis of pluripotency‐related and CSC‐related genes in Hec1 and HHUA cells. β‐Actin was also measured to ensure equal loading of a gel and a representative loading control for all sample is shown. (b) ALDEFLUOR assay to detect ALDH activity using flow cytometry in control and DUSP6‐overexpressing Hec1 cells. The numbers indicate the population of ALDH‐positive cells. (c) Bar graph showing the ALDH‐positive populations among control and DUSP6‐overexpressing Hec1 cells. (d) Growth curves of DUSP6‐overexpressing Hec1 and HHUA cells. A total of 1.0 × 10⁴ cells were plated in DMEM containing 10% FBS, and the number of cells was counted every other day. (e) Images of the colonies formed from DUSP6‐overexpressing Hec1 and HHUA cells. A total of 1.0 ×10³ single cells were cultured in a 6‐cm dish for 14 days. The resulting colonies were stained with Giemsa. (f) Bar graph showing the number of colonies that were ≥0.5 mm in diameter. (g) The proportions of control and DUSP6‐overexpressing Hec1 and HHUA cells in different cell‐cycle phases examined by flow cytometric BrdU‐labeling assay. The cells in the G0/G1, S and G2/M phases were gated. The numbers indicate the percentages of the cell population at each gate. (h) Bar graph quantifying the proportion of cells in each cell‐cycle phase. Data are representative of at least three independent experiments. Error bars indicate the standard deviation. *p < 0.05, **p < 0.01; N.S., not significant.
