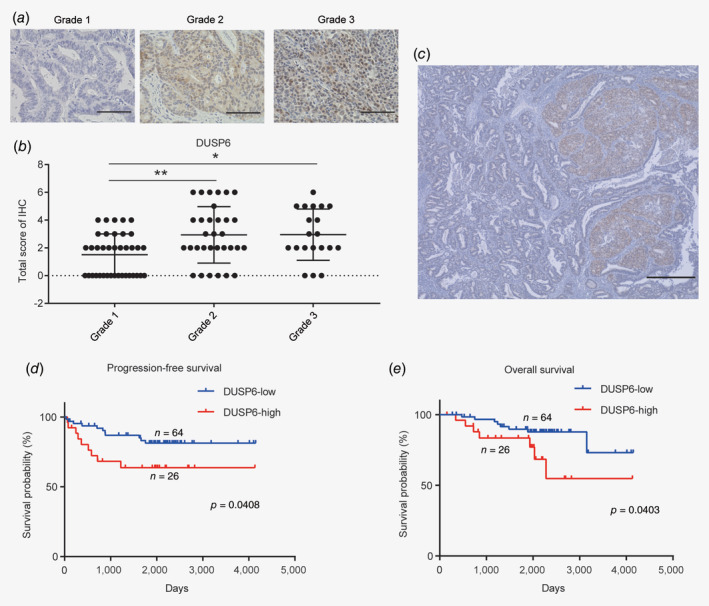
Figure 5.

High expression of DUSP6 is potentially associated with a poor prognosis in endometrial cancer. (a) Representative images of IHC staining of DUSP6. Scale bar, 100 μm. (b) Dot plot showing the IHC scores for DUSP6 expression in Grade 1, 2 and 3 tumors. The score was significantly higher for Grade 2 and 3 than for Grade 1 tumors. (c) High DUSP6 expression observed in the solid portion of the tumor. Scale bar, 500 μm. (d) Stratification of the cases into low‐ (n = 64; blue line) and high‐ (n = 26; red line) DUSP6‐expression groups according to the DUSP6 IHC score. PFS curves were plotted using the Kaplan–Meier method and compared using the log‐rank test. (e) OS curves were plotted using the Kaplan–Meier method and compared using the log‐rank test. Error bars indicate the standard deviation. *p < 0.05, **p < 0.01.
