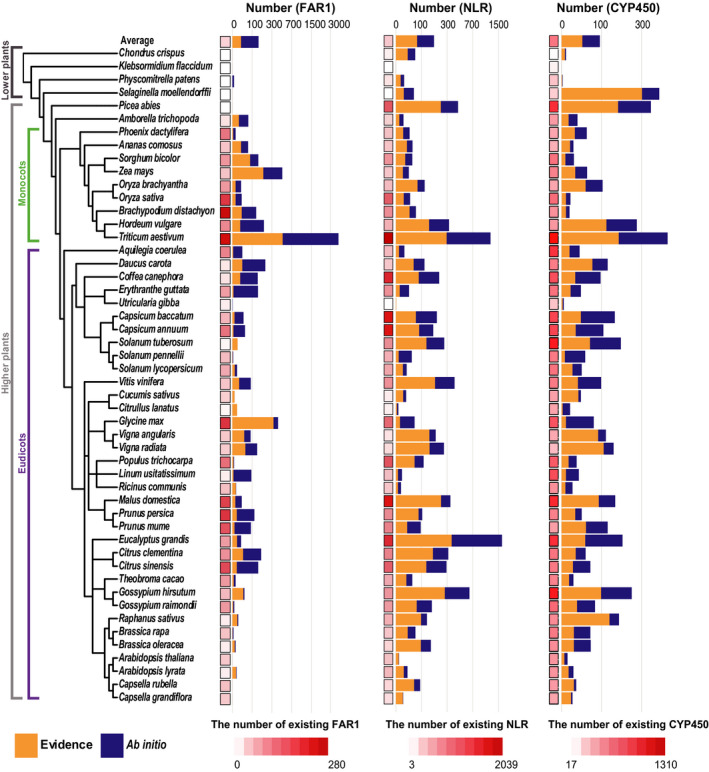
Fig. 5.

Re‐annotation of FAR1, NLR and CYP450 genes. The heat map indicates the number of existing target genes in representative loci of 50 plant genomes. Bar graphs show the number of newly annotated genes. Colors in the bar represent the number of newly annotated genes from protein or transcriptome evidence (orange) and ab initio model (navy blue).
