
Figure 2.
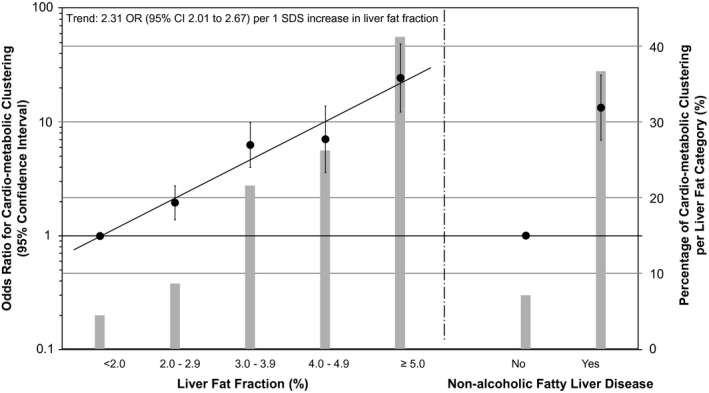
Associations of liver fat fraction and nonalcoholic fatty liver disease with odds of clustering of cardiometabolic risk factors at school age. Values are ORs (95% CI) analyzed in a subgroup of cases with complete data for all cardiometabolic variables (n = 1,906) that reflect the risk of cardiometabolic clustering per increase in liver fat fraction as compared with the reference group (<2.0%; left side of the figure) or for children with nonalcoholic fatty liver disease as compared with the reference group (children with <5.0% of liver fat; right side of the figure). Bars represent the percentage of cardiometabolic clustering per liver fat fraction group. Cardiometabolic clustering was defined as having three or more risk factors (high [greater than seventy‐fifth percentile] visceral fat mass, high [greater than seventy‐fifth percentile] systolic or diastolic blood pressure, low [less than twenty‐fifth percentile] HDL cholesterol or high [greater than seventy‐fifth percentile] triglycerides, and high [greater than seventy‐fifth percentile] insulin. Associations are adjusted for child age, sex, ethnicity, maternal prepregnancy BMI, and maternal education. Trend lines are given only when P value for linear trend <0.05.