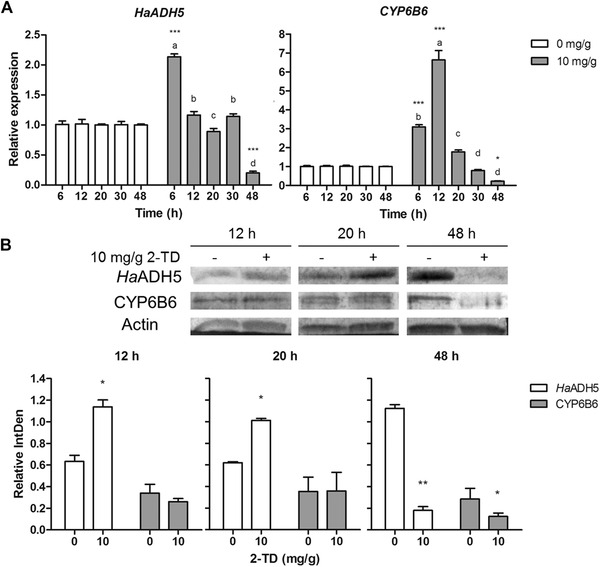
Figure 6.

The effect of 2‐tridecanone (2‐TD) on the expression of HaADH5 and CYP6B6 in the midgut of 6th instar larvae. (A) Relative expression of the target genes as indicated by messenger RNA transcript levels. (B) Relative amounts of protein. Different letters above the bars indicate significant differences between different time point samples under the same treatment condition (P < 0.05, one‐way analysis of variance test). Asterisks indicate significant differences between the treatment and the control at the same time point (* P < 0.05, ** P < 0.01, *** P < 0.001, paired t‐test).
