
Fig. 3.
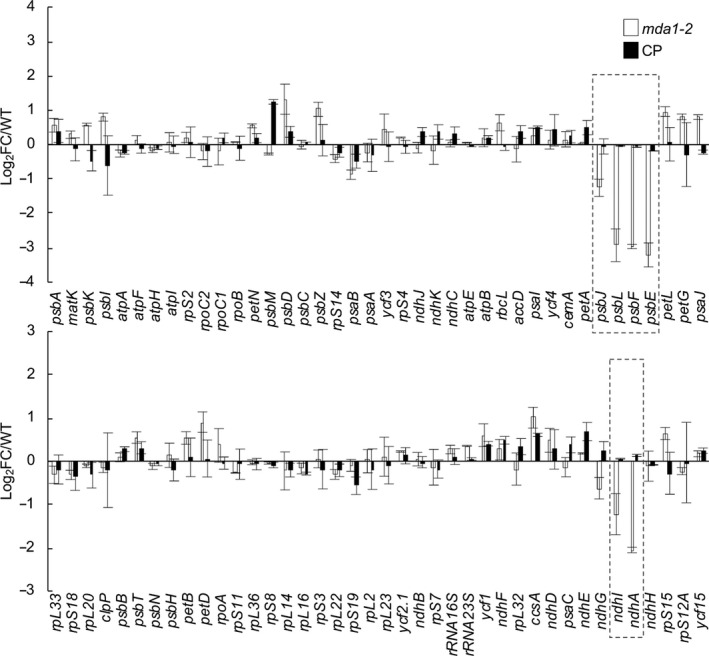
Steady‐state levels of chloroplast gene transcripts in Arabidopsis mda1. Transcript levels were determined by quantitative reverse transcription (qRT)‐PCR and are displayed as the log2 fold‐change (FC) between values obtained for the mutant or the complemented plants and the WT plants. Genes are ordered according to their genome positions. The nuclear ACT2 and TIP41 genes were used for data normalization. The values from two biological replicates performed each with technical triplicate were averaged per genotype and SEs are indicated.