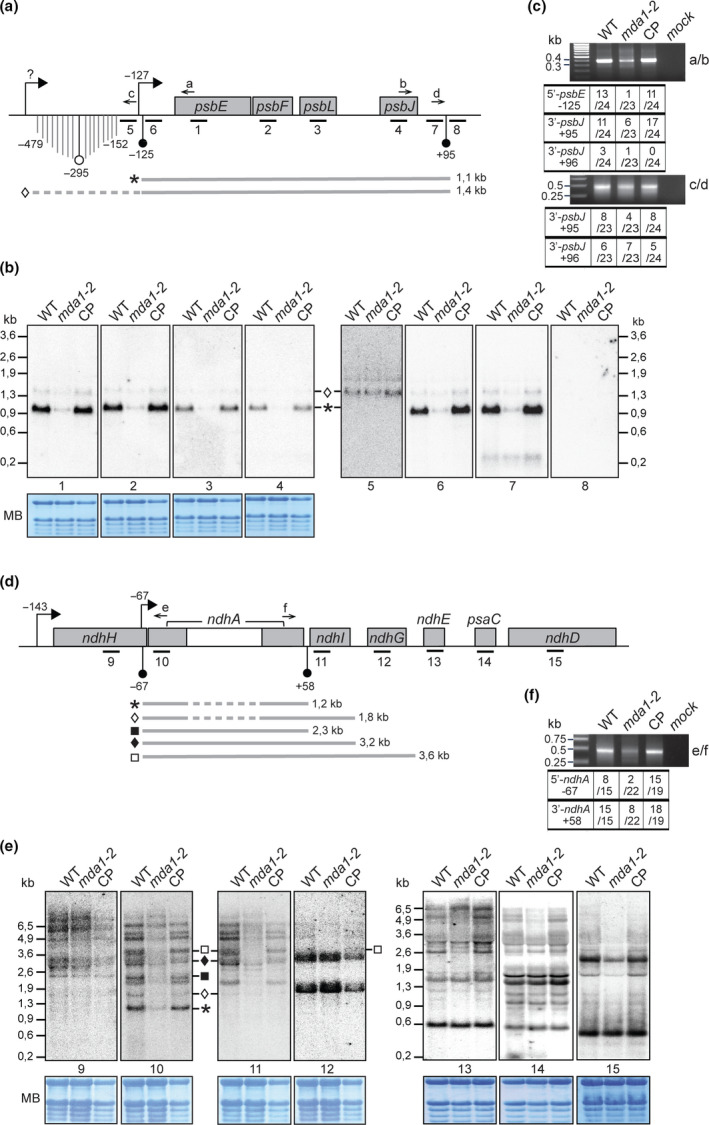
Fig. 4.

RNA gel blot analyses of transcripts of the Arabidopsis psbE and ndhH operons. (a) Genetic map of the psbE gene cluster indicating the positions of transcription initiation site (TSS) (right squared arrows) and mapped transcript termini (circle arrow tips). Positions are specified relative to gene start or stop codon. Black circle arrow tips indicate transcript termini whose positions coincide with the presence of an abundant sRNA in chloroplasts whose sequences are given in Supporting Information Fig. S4. (b) Replicate blots of wild‐type (WT), mda1‐2 and complemented plant (CP) RNA were hybridized with 60‐mer oligonucleotides strand‐specific probes whose positions are indicated beneath the map in (a). The methylene blue stained blots are shown to illustrate equal loading of rRNAs. Transcripts whose positions could be assigned from these results are diagrammed below the map and their length is given in kilobases (kb). (c) Mapping of transcript ends for psbE‐F‐J‐L genes in different genotypes by circularized reverse transcription (cRT)‐PCR. Primers used for PCR are indicated on the right and displayed on the map. The numbers of clones with the specified ends are indicated in the table. The RNA sequences of the predominant 5′ and 3′‐ends and the sRNAs are provided in Fig. S4. (d) Genetic map of the ndhA gene cluster. (e) RNA blots hybridized with strand specific probes. (f) Mapping of transcript ends for ndhA gene by cRT‐PCR.
