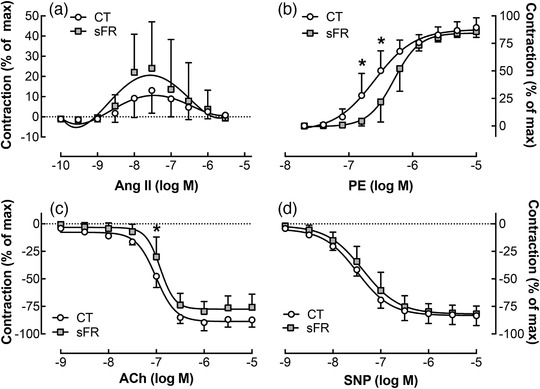
FIGURE 3.

Effects of severe food restriction (sFR) on vasomotricity in femoral arteries from male rats. Shown are concentration–response curves in femoral vessels from control (CT; open circles) and sFR (filled squares) rats after the addition of angiotensin II (Ang II; a), phenylephrine (PE; b), ACh (c) and sodium nitroprusside (SNP; d). Values are expressed as the mean ± SD; * P < 0.05 versus CT, same time point, by two‐way ANOVA with repeated measures (diet and response) and Tukey's post hoc test; CT, n = 7; sFR, n = 6
