
FIGURE 6.
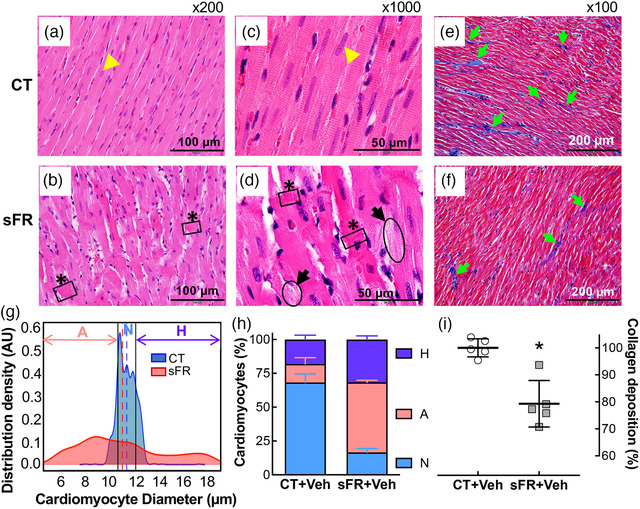
Effect of severe food restriction (sFR) on cardiac pathology. Shown are representative heart sections stained with Haematoxylin and Eosin (H & E; a–d) or Masson's Trichrome (e,f) from control (CT; a,c,e) and sFR (b,d,f) rats. (a–d) The H & E staining showed myofibrillar disarray with contractions (black boxes highlighted asterisks) and cardiomyocyte lysis (black ovals highlighted by black arrows) in sFR rats at ×200 (a,b) and ×1000 (c,d) magnification. (e,f) Masson's Trichrome staining of collagen, indicated by blue staining (green arrows) at ×100 magnification, revealed that there was less collagen present in the sFR group compared with the CT rats. The H & E and Masson's Trichrome images are representative of five rats per group; a yellow arrowhead indicates the nucleus. (g) Gaussian kernel density estimates of cardiomyocyte diameter from H & E‐stained hearts in CT (aqua curve) and sFR (pink curve) groups. The vertical dashed lines represent the mean in each group. (h) Quantification of the percentage of cardiomyocytes below (pink bar) and above (purple bar) the normal (aqua bar) range of cardiomyocyte diameter revealed greater numbers of atrophied and hypertrophied cardiomyocytes in sFR hearts; * P < 0.001 versus CT by Gaussian kernel density analysis. (i) Percentage of collagen staining in sFR rat hearts normalized to the staining in the CT group; * P < 0.05 versus CT, by Student's unpaired t test. Abbreviations: A, atrophied cardiomyocytes; H, hypertrophied cardiomyocytes; and N, normal cardiomyocytes