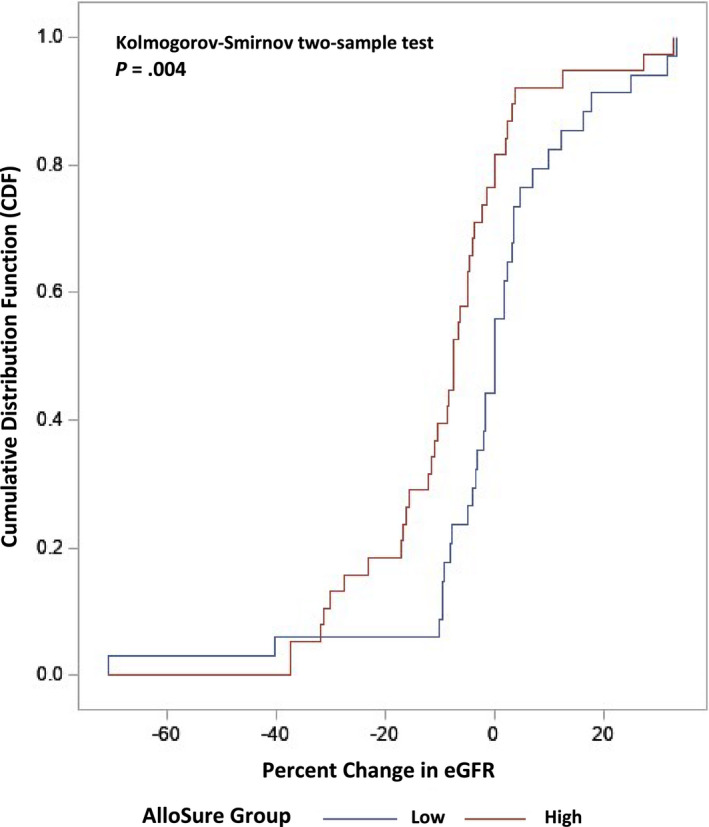
Figure 3.

Cumulative distribution functions of the percent change in estimated glomerular filtration rate (eGFR) from diagnosis of T cell–mediated rejection (TCMR) 1A and borderline up to 6 months after event [Color figure can be viewed at wileyonlinelibrary.com]
