
FIGURE 2.
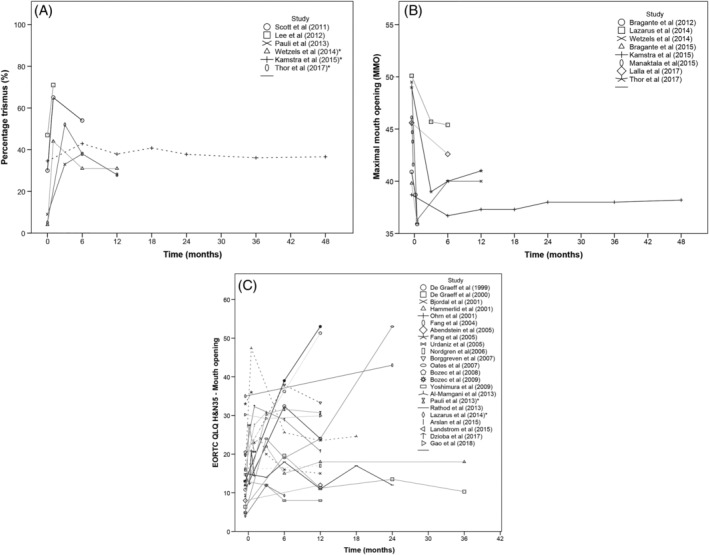
A, Longitudinal evaluation of percentage of patients with trismus. * indicates that study reported trismus as a secondary outcome. Broken lines display studies that had overlapping data with other studies. The studies that contained the largest sample size are displayed as straight lines. B, Longitudinal evaluation of maximal mouth opening. Broken line displays studies that had overlapping data with other studies. The studies that contained the largest sample size are displayed as straight lines. C, Longitudinal evaluation of patient's quality of life score‐domain: difficulties opening the mouth. * indicates that study reported patient's score of perceived difficulties opening the mouth as a secondary outcome. Broken lines display studies that had overlapping data with other studies. The studies that contained the largest sample size are displayed as straight lines