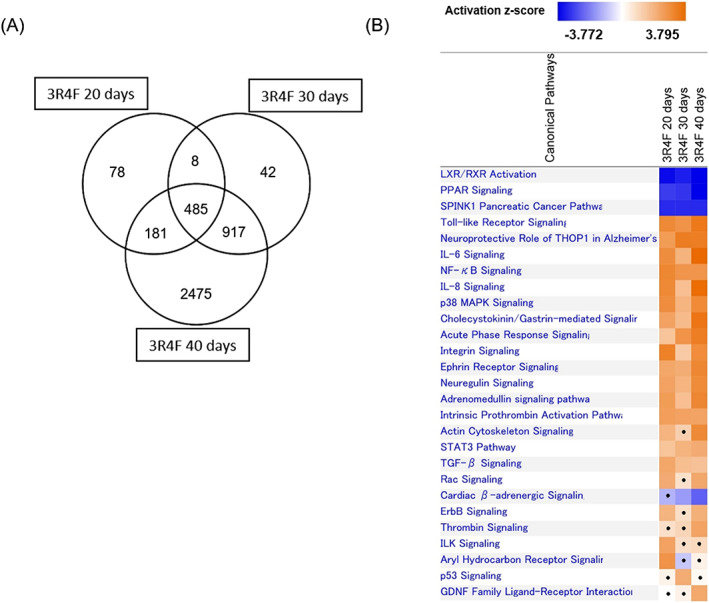
FIGURE 5.

Time‐course analysis of transcriptomic alterations resulting from repeated exposure to cigarette smoke. A, Venn diagram of differentially expressed genes. B, Canonical pathway analysis of differentially expressed genes at days 20, 30 and 40. Significantly perturbed pathways are shown in the heatmap with z‐score. Positive and negative value of z‐score represent predicted activation and inactivation of the biological pathways respectively. Pathways did not reach statistical significance (P ≥ .05) are shown with dot. IL, interleukin; LXR/RXR, liver/retinoid X receptor; MAPK, mitogen‐activated protein kinase; NF‐κB, nuclear factor kappaB; PPAR, peroxisome proliferator‐activated receptor; TGF, transforming growth factor
