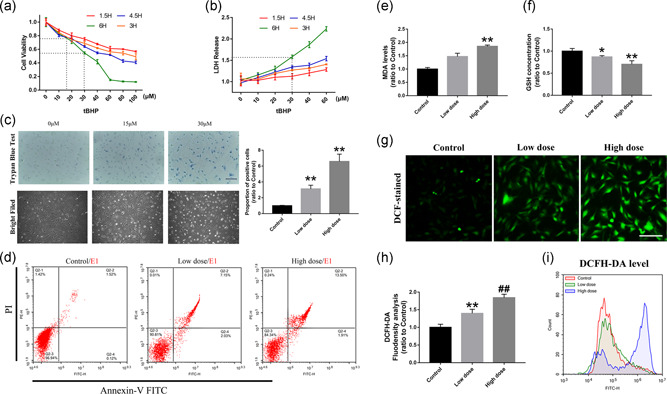
Figure 1.

tBHP can induce oxidative stress damage in RACs. (a,b) The CCK‐8 and LDH results of RACs treated with different tBHP concentrations. The 15 and 30 μM tBHP led to 75% and 55% cell viability, respectively. (c) Trypan blue staining and bright field imaging of RACs under 15 μM (low dose) and 30 μM (high dose) tBHP treatment. The number of positively stained cells was highly increased and the low tBHP‐treated cells showed a significant change in cell morphology. (d) Flow cytometry detection of cell apoptosis in the low‐dose and high‐dose tBHP treatment groups by annexin V–FITC staining. Significant increase in apoptosis level can be observed in the low dose‐treated groups. (e,f) The results of intracellular MDA levels and GSH concentrations in low‐dose tBHP‐treated RACs. MDA increased with increasing tBHP concentrations, and GSH declined as the drug dose increased. (g–i) DCFH‐DA immunofluorescence staining and flow cytometry detection of RACs under different tBHP treatments. Intracellular ROS levels and DCFH‐DA‐positive cells were significantly enhanced by tBHP. Scale bar = 100 μm. The results are expressed as mean ± standard deviation. CCK‐8, cell counting kit‐8; DCFH‐DA, dichloro‐dihydro‐fluorescein diacetate; FITC, fluorescein isothiocyanate; GSH, glutathione; LDH, lactate dehydrogenase; MDA, malondialdehyde; RAC, retinal astrocyte; ROS, reactive oxygen species. *p < .05 and **p < .01 versus control; and ## p < .01 versus Low dose
