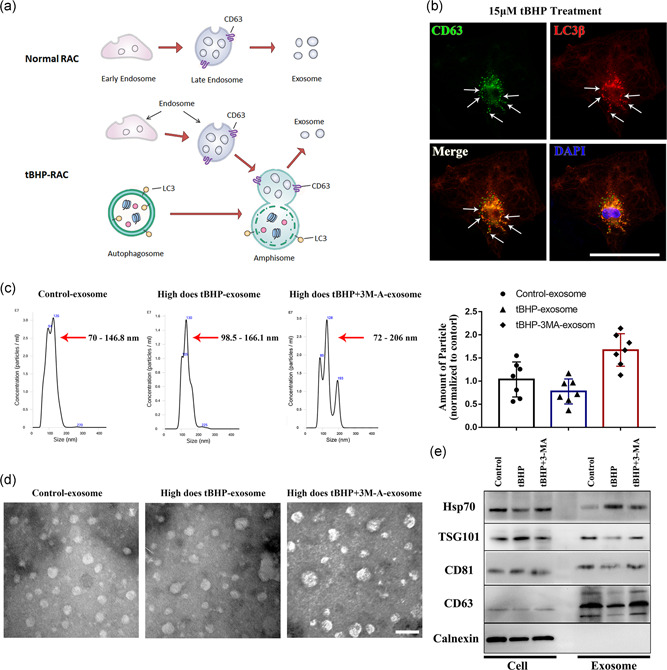
Figure 5.

The exosomes generated from normal RACs, tBHP‐treated RACs, and tBHP+ 3MA‐treated RACs show significant differences. (a) The process of exosome formation in normal cells or high‐autophagy level cells. (b) Amphisomes labeled by CD63 and LC3β can be observed in tBHP‐treated RACs (white arrows). (c,d) NanoSight analysis and transmission electron microscopy images of normal, tBHP‐ and tBHP+ 3MA‐treated RAC‐derived exosomes. The normal RAC‐derived exosomes had a smaller size and higher concentration than the tBHP‐RAC‐derived exosomes. The 3MA can further enlarge the particle size and elevate the concentration. (e) Western blot results of the exosome biomarker in cells and exosome samples. The expression of HSP70, TGS101, CD81, and CD63 was obviously different between the control, tBHP, and tBHP + 3MA exosomes. Scale bar = 100 μm in the immunofluorescence images; scale bar = 200 nm in the transmission electron microscopy images. 3MA, 3‐methyladenine; CD63, cluster of differentiation 63; CD81, cluster of differentiation 81; HSP70, 70 kDa heat shock protein; LC3β, light chain 3β; RAC, retinal astrocyte; tBHP, tert‐butyl hydroperoxide; TGS101, tumor susceptibility gene 101
