
FIGURE 1.
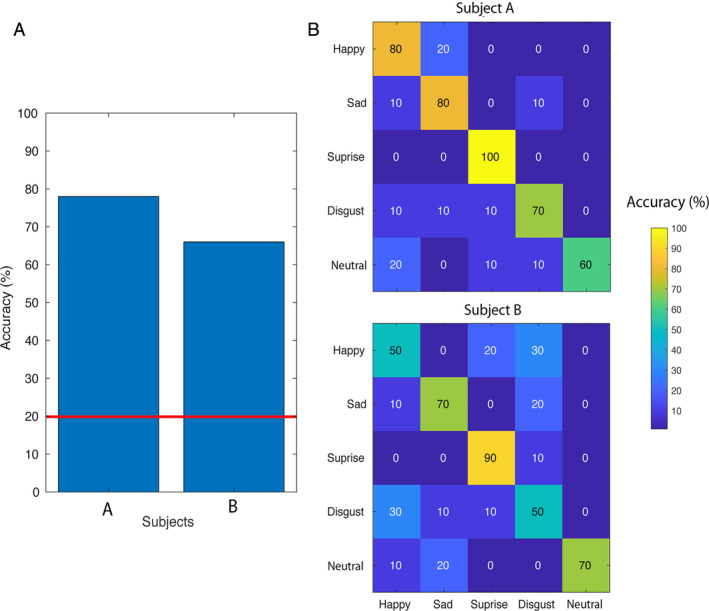
Classification accuracies and confusion matrices. (A) The classification accuracies (y‐axis) for both participants (x‐axis). The red line represents chance level. (B) The confusion matrices are shown for Subject A and B, respectively, with on the y‐axis the actual expression and on the x‐axis the predicted expression. [Color figure can be viewed at www.annalsofneurology.org]