FIGURE 3.

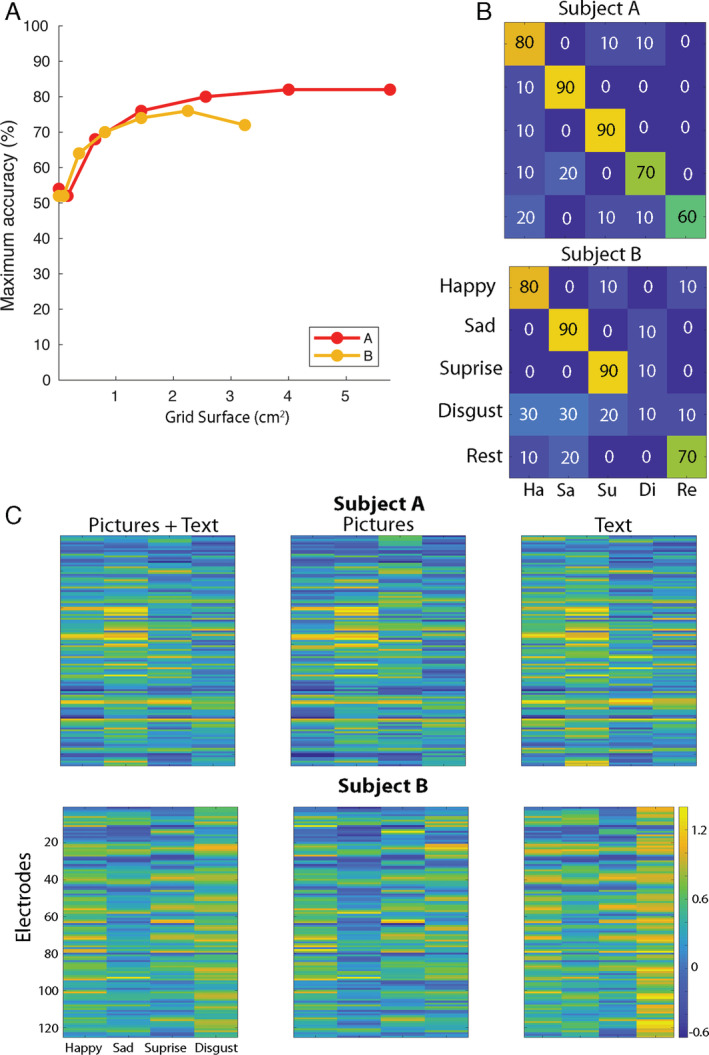
The influence of grid size and presentation type on classification accuracy. (A) On the y‐axis, the maximum classification accuracy (from all grid locations in the searchlight) is indicated for both participants per size of cortical surface, which is indicated on the x‐axis. Results were obtained using the searchlight approach, in which, for each sampled area of cortex, the classification accuracy was determined. Note that the number of electrodes of each consecutive data point in this plot is equal for both participants, but owing to differences in the resolution, the covered surfaces differ. (B) The confusion matrices of classification with templates based on the opposite presentation type are shown. That is, picture trials were classified using templates based only on text trials and vice versa. The confusion matrices are shown for Subject A and B, respectively, with on the y‐axis the real expression and on the x‐axis the predicted expression. By doing so, classification can be driven only by activity common in both presentation types and is therefore more likely to be attributable to the facial movements than to the stimulus presentation. Note, however, that as the number of trials per presentation type is rather limited (5 per class), stability of the templates may be reduced. Therefore, in all other classification analysis, we included both text and picture trials. (C) The facial expression neural activity templates are shown per Subject A and B. On the x‐axis, the facial expressions are indicated. On the y‐axis, electrodes are shown. The color scale indicates the normalized neural activity level, and each cell indicates the average neural activity level for one electrode based on all trials (left), on picture trials only (middle), or text trials only (right). [Color figure can be viewed at www.annalsofneurology.org]
