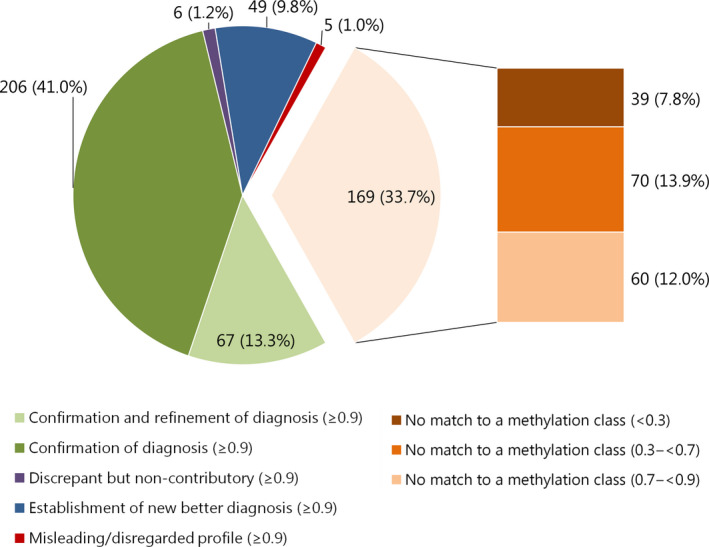
Figure 2.

Effect of methylation profiling on diagnosis signed out to the clinicians for 502 cases with a calibrated score ≥0.9: light orange pie section represents all ‘no match’ cases combined. These are subdivided into calibrated scores <0.3; 0.3 to <0.7 and 0.7 to <0.9 in the bar to the right of this pie section. Labels represent: n (%) of 502 cases total.
