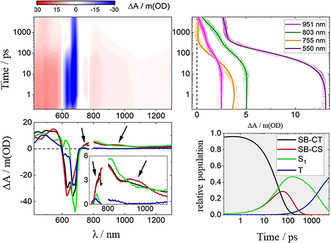
Figure 4.

Top left: Differential absorption 3D map obtained upon fsTAS of NCND‐ZnPc in methanol at room temperature upon excitation at λ=387 nm. Top right: time absorption profiles and corresponding line fittings at λ=951 (magenta), 803 (dark green), 755 (orange), and 550 nm (purple). Bottom left: species‐associated differential spectra of the SB‐CT (black), SB‐CS (red), S1 (green), and T1 (blue) excited states. Bottom right: concentration evolution over time.
