Figure 5.

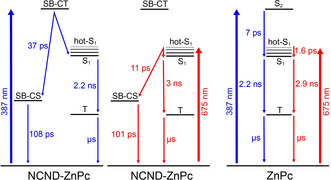
Target models employed to fit the fsTAS data. Left: NCND‐ZnPc conjugate under excitation at λ=387 nm. Center: NCND‐ZnPc conjugate under excitation at λ=675 nm. Right: ZnPc reference under excitation at λ=387 and 675 nm.

Target models employed to fit the fsTAS data. Left: NCND‐ZnPc conjugate under excitation at λ=387 nm. Center: NCND‐ZnPc conjugate under excitation at λ=675 nm. Right: ZnPc reference under excitation at λ=387 and 675 nm.