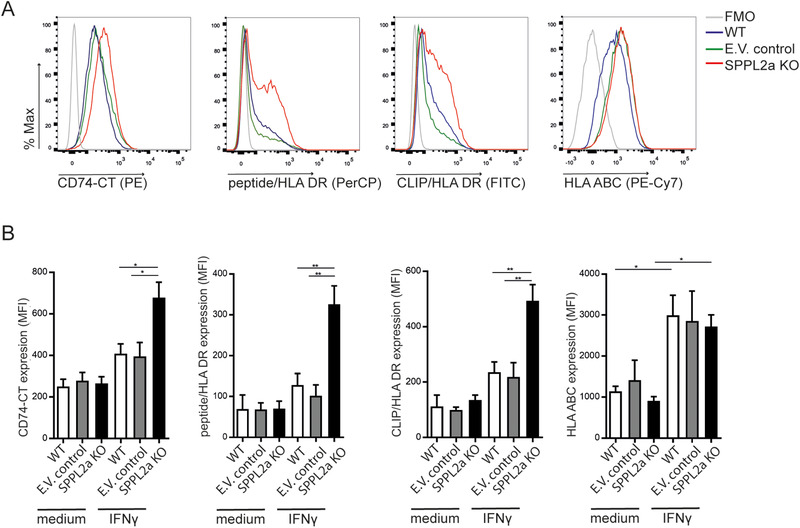
Figure 3.

SPPL2a KO cells exhibit increased surface display of full‐length CD74, peptide‐bound HLA‐DR, and CLIP‐bound HLA‐DR upon IFN‐γ stimulation. (A) Representative histogram of flow cytometry analysis of expression of full‐length CD74 C‐terminal (CT; LN2), CLIP‐bound to HLA‐DR (CerCLIP), peptide‐bound HLA‐DR (L243), and HLA‐ABC (G46‐2.6) on WT, E.V. control, or SPPL2a KO THP‐1 cells, incubated in the presence of IFN‐γ for 24 h. (B) Mean fluorescence intensity (MFI) of CD74, CLIP‐bound to HLA‐DR, peptide‐bound to HLA‐DR, and HLA‐ABC on THP‐1 cells from (A). The gating strategies are shown in Supporting Information Fig. 5A. (B) Error bars show mean and SEM from four independent experiments with one sample condition/experiment. The mean is represented in the dot plot. *p < 0.05; **p < 0.01; unpaired t test.
