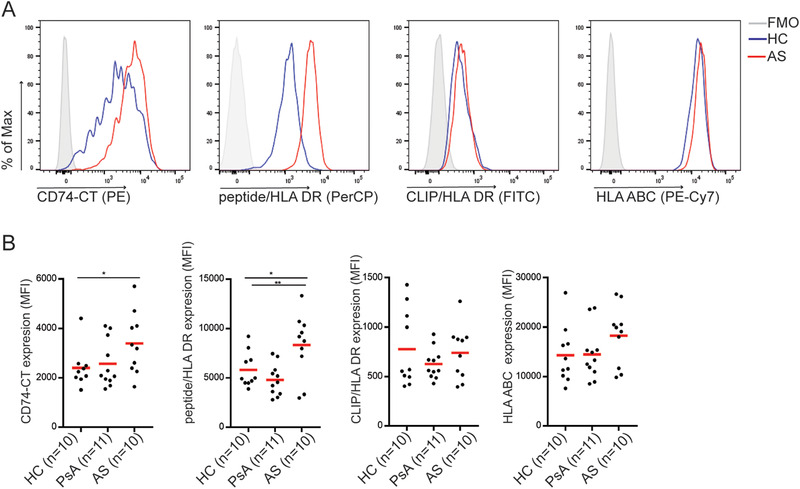
Figure 4.

Monocytes from AS patients have increased full‐length CD74 and peptide‐bound HLA‐DR expression. (A) Representative histogram of flow cytometry analysis of expression of full‐length CD74 C‐terminal (CT;LN2), CLIP‐bound to HLA‐DR (CerCLIP), peptide‐bound HLA‐DR (L243), and HLA‐ABC (G46‐2.6) on CD14+ monocytes from HC or AS patient. The gating strategies are shown in Supporting Information Fig. 5B. (B) Dot plot represents the mean fluorescence intensity (MFI) of the cell surface molecules measured from each donor. The mean is represented in the dot plot. Data combined from three independent experiments with three to four HC, PsA, or AS samples per experiment. *p < 0.05; **p < 0.01; unpaired t test.
