Figure 3.

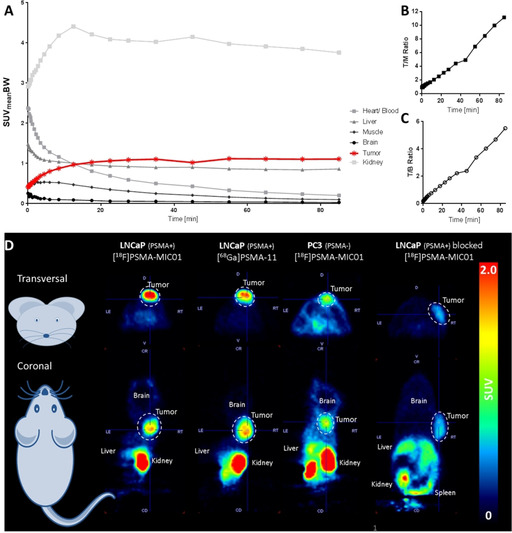
Organ distribution of [18F]PSMA‐MIC01 in a murine model. (A) Time‐activity curves in several organs during a 90 min dynamic PET scan, calculated based on the body‐weight corrected Standardized Uptake Value (SUVmeanBW). The values are represented as Mean (n=6). SD is removed for readability (for complete graphs, see Supporting Information). (B) Tumor‐to‐muscle (T/M) ratio. (C) Tumor‐to‐blood (T/B) ratio. (D) Representative PET images obtained during a 30 min static PET scan, started 60 min p.i. The dotted lines highlight the tumors (LNCaP‐ or PC3‐ xenografts). The first two scans shown, [68Ga]PSMA‐11 and [18F]PSMA‐MIC01, are performed in the same animals on consecutive days. The upper row shows the transversal view on mouse and the lower row the coronal view.
