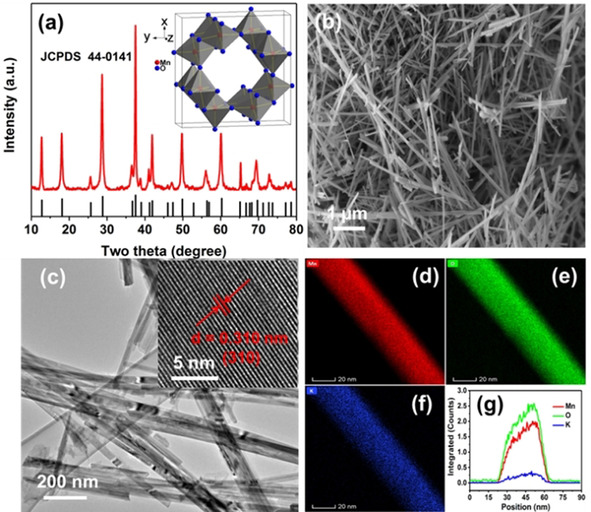
Figure 1.

Characterizations of α‐MnO2. a) XRD pattern. b) Representative SEM image. c) Representative TEM image [inset showing the HRTEM image with a lattice distance of 0.310 nm corresponding to the (3 1 0) plane]. d–f) STEM‐EDS mappings of the elemental distributions of Mn, O and K in the MnO2. g) Line profiles of Mn, O and K across the MnO2 nanorod.
