
Figure 3.
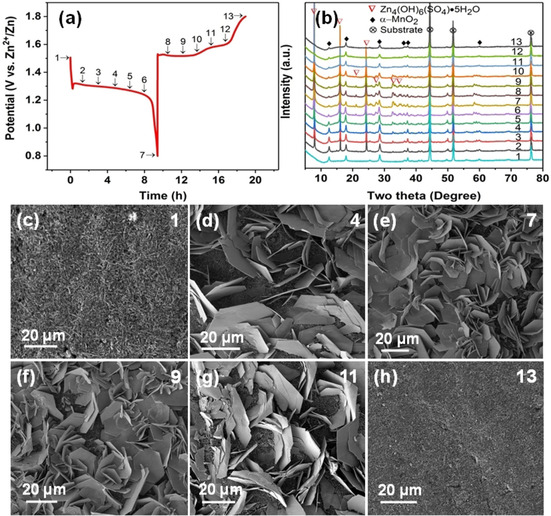
a) Typical profile during the first discharge–charge process at 30 mA g−1. b) Evolution of ex situ XRD patterns of MnO2 electrodes recorded at different states denoted in a). c–h) Corresponding SEM images of MnO2 electrodes collected at states denoted by 1, 4, 7, 9, 11 and 13.